Apichat Noipang/iStock via Getty Images
Written by Nick Ackerman, co-produced by Stanford Chemist.
Income investors tend to look for investments that can pay steady dividends, and when evaluating choices, which can mean those that have a long history without any cuts. Closed-end funds, perhaps notoriously, almost always eventually tend to cut their payouts over time. This is because a large portion is leveraged, so when a crash comes, those downside moves are amplified, and that tends to lead to potentially permanent capital destruction.
However, the simple fact is that CEFs tend to pay out the majority of their earnings. Therefore, they are going to be more susceptible to cuts rather than increases naturally. One of the reasons a C-corp can grow its dividends over time is that it retains earnings and uses that to attempt to grow future earnings; thus, as earnings grow over time, so can what the company is paying out to investors.
Of course, there are times when CEFs pay out even more than they can reasonably earn between income and capital gains from the underlying portfolio. So, in many cases where they aren’t covering their payouts, net asset values can decline over time, and eventually, a distribution cut would be needed. Remember, CEFs can pay out whatever they’d like as long as the NAV remains above $0.
With that being said, that isn’t always the case. Today, we are looking at funds that have never cut their distribution since their inception. Not only that, but the funds with inception prior to the Global Financial Crisis.
A CEF could have launched a few years ago and never cut their distribution, but that isn’t necessarily impressive, as we’d have a really short track record. Funds with an inception prior to 2008/09’s GFC means they’ve now experienced two black swan events.
This is actually a revisit of the topic that we’ve touched on previously on a few different occasions. The last time was June 20, 2022, so it has been a while.
Interestingly, every fund that made the list last time made it again this time. However, we’ll be taking a close look at the distribution coverage. Between then and now, interest rates have increased aggressively, and in that prior update, the Fed target rate raises were really just starting. All but one of these funds are leveraged funds, meaning they saw significant increases in their leverage costs during this time.
YCharts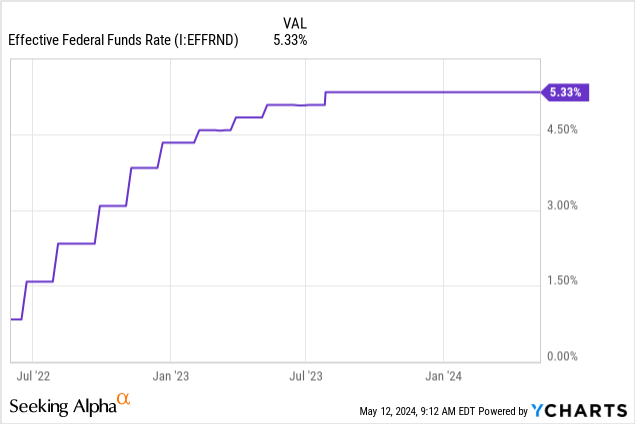
Finally, it is worth noting that we are just looking at the regular distributions. If a fund paid out a special at year-end for regulatory purposes, we won’t be factoring that in if they paid a smaller one or none at all in the following year.
PIMCO Corporate & Income Strategy Fund (PCN)
Looking at PCN, its inception goes back to right near the end of 2001. This fund has crossed over the two-decade mark, and it continues to pay its monthly distribution to investors at a steady clip. The fund launched with a monthly distribution of $0.1063, and today, it stands at $0.1125.
PFN Distribution History (CEFConnect)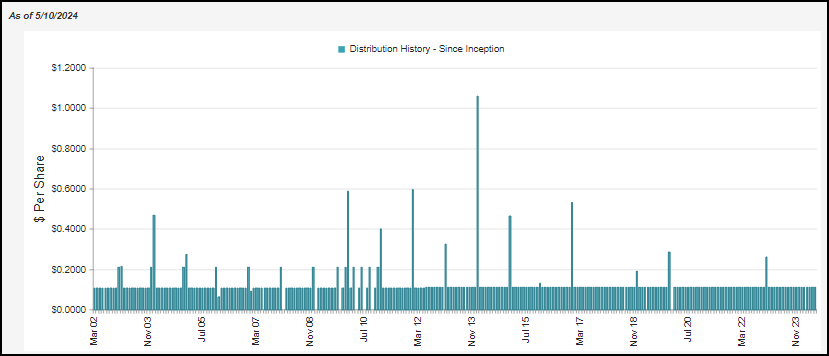
It is perhaps fitting that it is a PIMCO fund that makes this list because they are generally known to hold their distributions steady for long periods of time.
However, the last time we took a look at the fund, the coverage was incredibly strong. It was well over 100% in each of the 3 and 6-month rolling periods. As rates rose materially, so did their borrowing costs, and that saw a negative impact on coverage when looking at the latest UNII report.
Below is the UNII report for the month end of March.
PIMCO March 2024 UNII Report (PIMCO)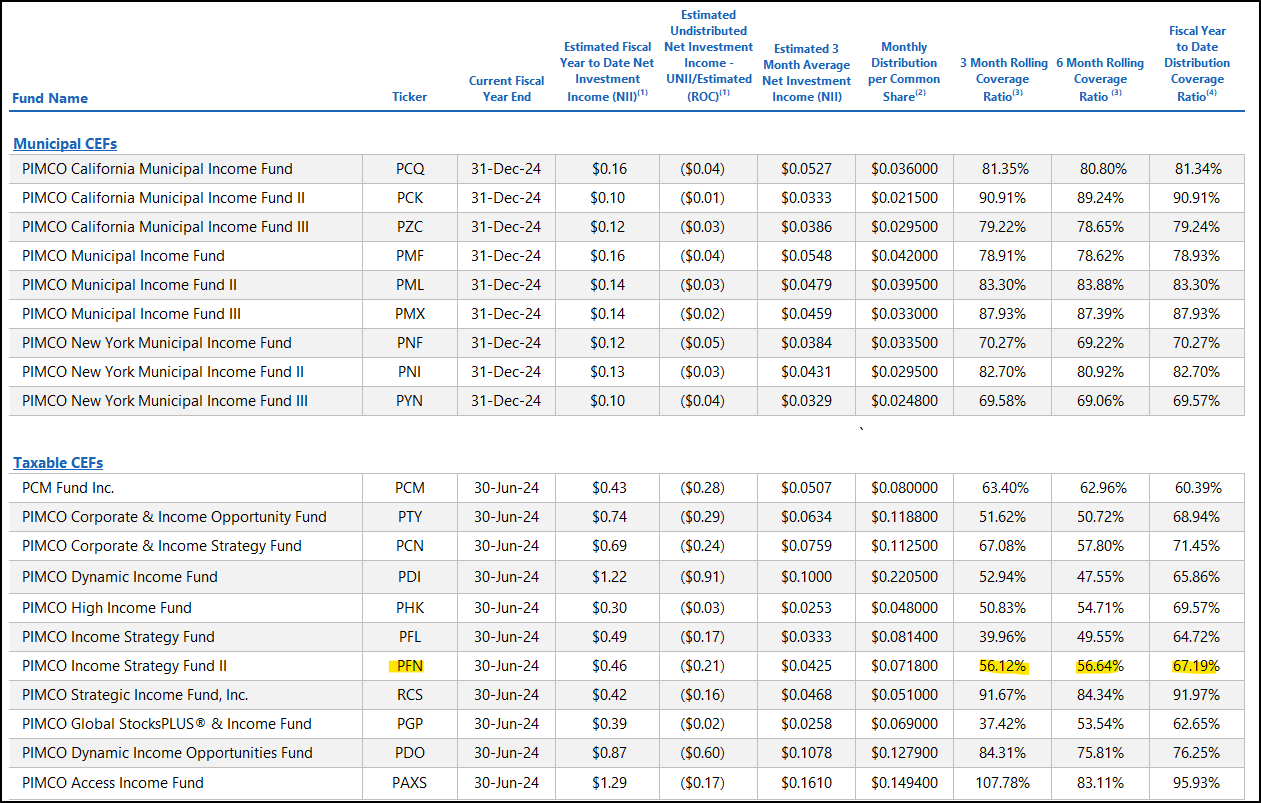
On a brighter note, the latest UNII report for the month end of April saw this increase. We still aren’t over 100% of NII coverage, but the increase month-over-month was material. This helps highlight the fluctuations that can happen throughout the year.
PIMCO April 2024 UNII Report (PIMCO)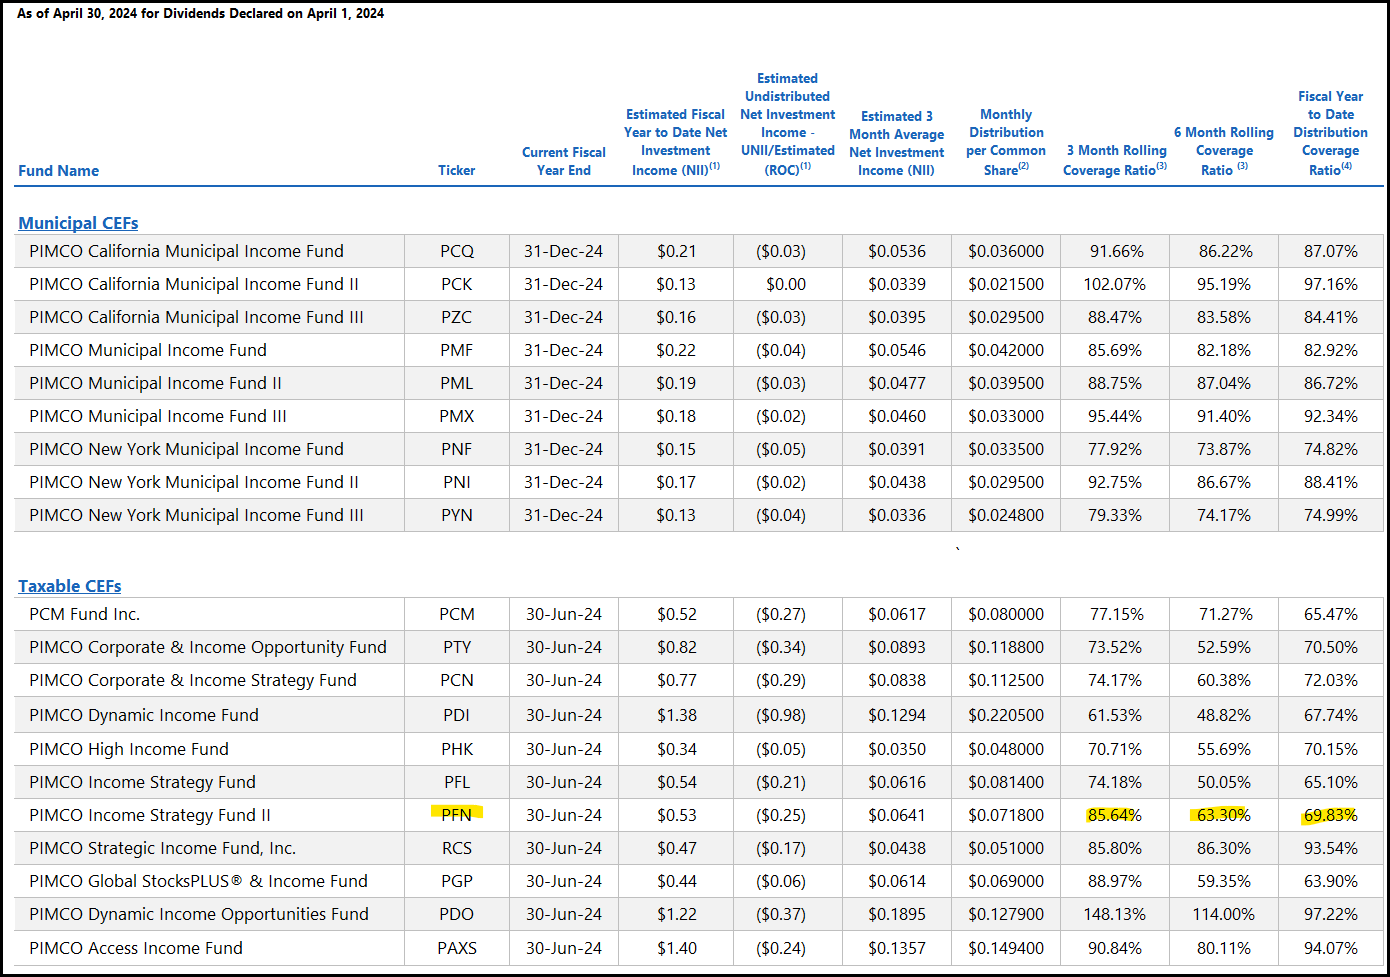
Furthermore, the fund uses a number of derivatives (as is commonly the case for PIMCO funds) that can help support the distribution through capital gains and manage interest rate risk. At a current NAV distribution rate of 11.82%, I don’t see it as being too elevated at this time. PIMCO has let its funds run well above that level in terms of yield, and some of its peers are significantly above that level currently.
As far as the valuation, sitting at around a 10% premium doesn’t make it cheap, but relative to its history, this also doesn’t make it expensive.
PFN Discount/Premium History (CEFConnect)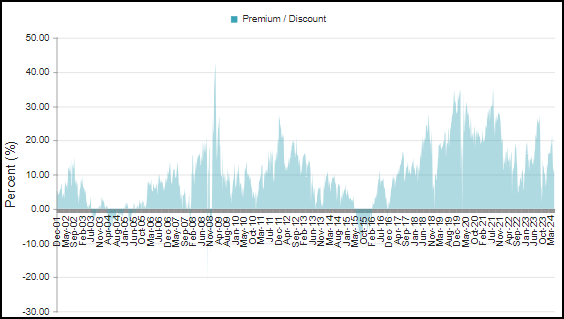
Guggenheim Strategic Opportunities Fund (GOF)
GOF is an income investor favorite, but one that I continue to remain skeptical about. It’s been several years now, so I guess why should I change my feelings now? Really, nothing about GOF’s situation has changed. In fact, it has gotten worse. It continues to surprise me that they haven’t cut. I suspected they could be one to cut before too long.
To conclude, I remain skeptical that GOF can continue this payout without being destructive to the fund. That will make it more difficult to continue paying their current distribution.
Rate cuts would benefit this fund, but those are seemingly getting pushed back further and further. For now, with rates stabilizing, that has admittedly helped the fund a bit. When we last talked about GOF, the NAV rate was 15.27%, and now it is over 18%. The fund has to earn that NAV rate plus the operating expenses to cover the distribution. That pushes up against a 20% level that the fund would need to perform going forward.
Currently, the fund’s net investment income coverage came to less than 39%. Fortunately for investors, the NII has slightly started to head in the right direction if the last semi-annual report is any indicator.
GOF Financial Metrics (Guggenheim (highlights from author))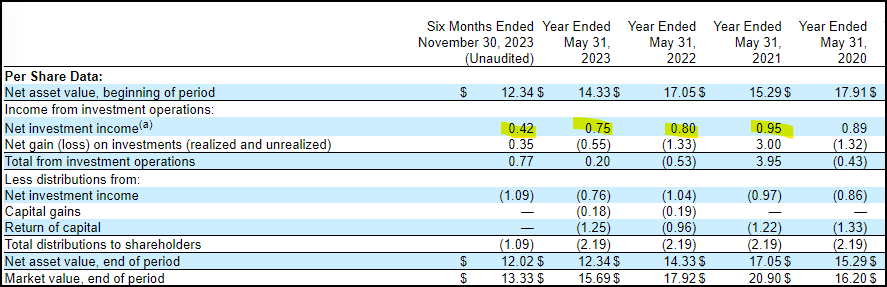
The distribution not being earned is really only half the problem with the fund. The other half is that it is looking like it is heading back toward a higher premium once again. Similar to PCN, a premium isn’t that unusual, but we are getting toward the higher historical level once again.
GOF Discount/Premium History (CEFConnect)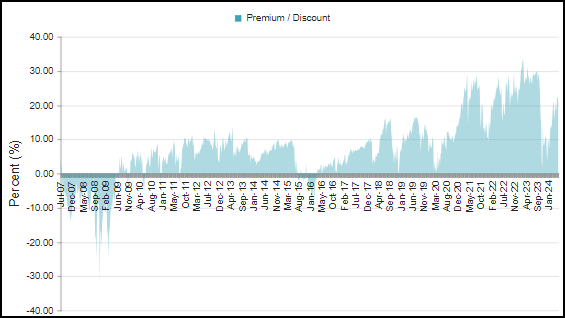
BlackRock Health Sciences Trust (BME)
This is a non-leveraged fund focused on the healthcare sector. Since its inception on March 28, 2005, it has maintained its regular distribution without any cut. It started out with a quarterly distribution and switched to a monthly schedule but maintained the equivalent amount. Since then, they even bumped it up a touch twice.
BME Distribution History (CEFConnect)
I covered BME quite recently, and to sum up, it looks attractively valued, and the distribution continues to look solid today.
Gabelli Global Utility & Income Trust (GLU)
From there, we now have the last three funds to touch on – all three of them being utility/infrastructure-focused funds. Starting out with GLU, this is one that I don’t follow regularly, though with this fund hitting the market in 2004, it makes the list. They pay $0.10 per month and have done so since the fund’s inception.
GLU Distribution History (CEFConnect)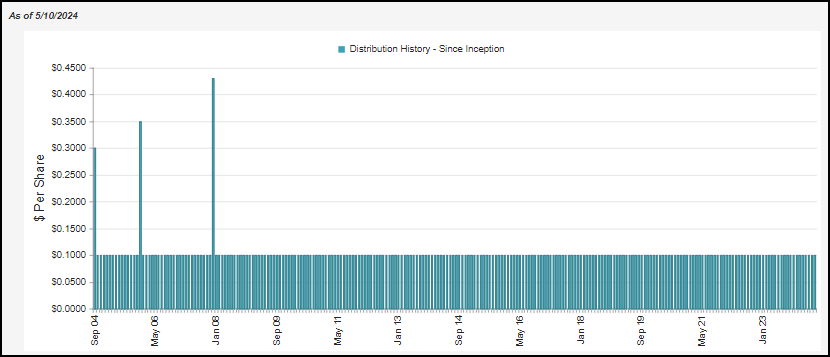
At an NAV rate of 7.76%, that isn’t a red flag either. However, it did come up from the 6.31% rate we were at previously as rates put pressure on the fund’s underlying holdings and, therefore, saw the NAV decline.
In comparison, though, that is nothing like its sister fund, Gabelli Utility Trust (GUT), which has seen its NAV distribution rate touch ~20% these days. If that is worth anything, then Gabelli isn’t likely to be cutting GLU’s distribution anytime soon – and even better, this fund trades at a reasonable valuation. Again, that’s unlike GUT, and it’s ~100% premium.
YCharts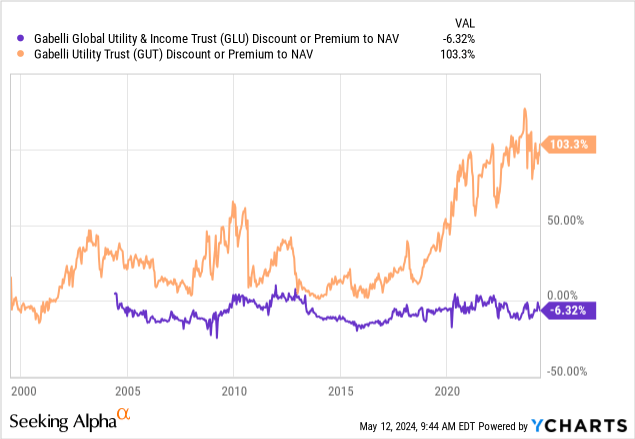
Due to GUT’s extreme premium, investors receive less of a difference relative to GLU. GLU’s distribution rate based on market price is 8.28%, and GUT’s is 9.84%. Sure, that’s 156 basis points of difference, but the difference in what GUT has to earn over GLU in order to be considered covered is 1224 basis points. That difference is nearly 8x and works out to GUT needing to earn over 2.5x what GLU does.
Even with GUT being able to sell shares accretively, it is just too precarious of a situation given the premium. For investors in GUT, I hope they somehow can maintain the distribution. If it is cut, investors could look at an over 50% loss nearly immediately based on historical reactions.
DNP Select Income Fund (DNP)
DNP is another income-investor favorite, and one that I have owned in the past as well. I certainly like DNP at the right valuation, and this is the oldest of all the funds discussed today, with inception going back to 1987. They’ve maintained the $0.065 distribution since the late 90s, and that means this fund went through three different outsized market declines.
The distribution chart below only goes back to 1996, but the distribution data can be confirmed with Fidelity’s information. The fund initially started with a $0.04 monthly distribution. The $0.06 started in the late 80s and, as we can see in the chart below, continued through the mid-90s. Between the $0.04 and $0.06, they also paid $0.045, $0.05 and $0.055 for relatively short periods of time.
DNP Distribution History (CEFConnect)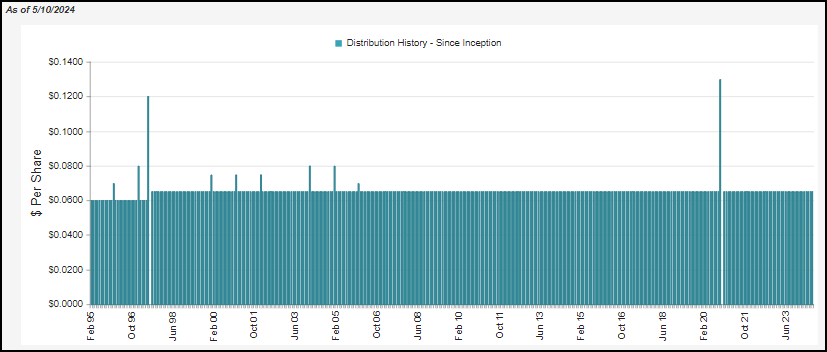
A fund coming up on four decades with no distribution cuts is certainly brag-worthy, but this is another fund that could really use some rate cuts to ease the pressure between increasing borrowing costs and the utility portfolio taking a hit. The NAV rate has currently been flirting around ~10%, and along with the fund’s operating expenses, that’s pushing closer to the 11 to 12% that the fund would need to earn. It isn’t that the fund hasn’t endured these types of declines before and for even longer periods of time.
DNP NAV/Share Price History (CEFConnect)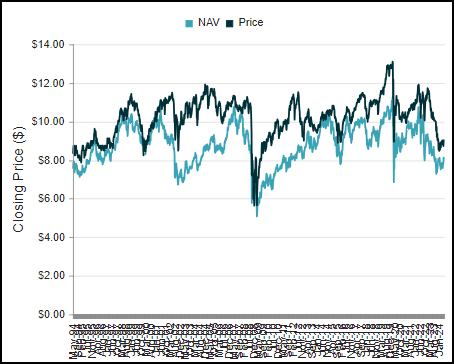
That said, this is a different environment where rates are rising and aren’t expected to go back down to 0% unless we see an economy that slows down severely. An economy that slows down severely would naturally come with its own other difficulties.
Reaves Utility Income Trust (UTG)
UTG is another popular CEF for income-focused investors because it has not only maintained its distribution but can boast a relatively regular trend of increasing its distribution over time.
UTG Distribution History (CEFConnect)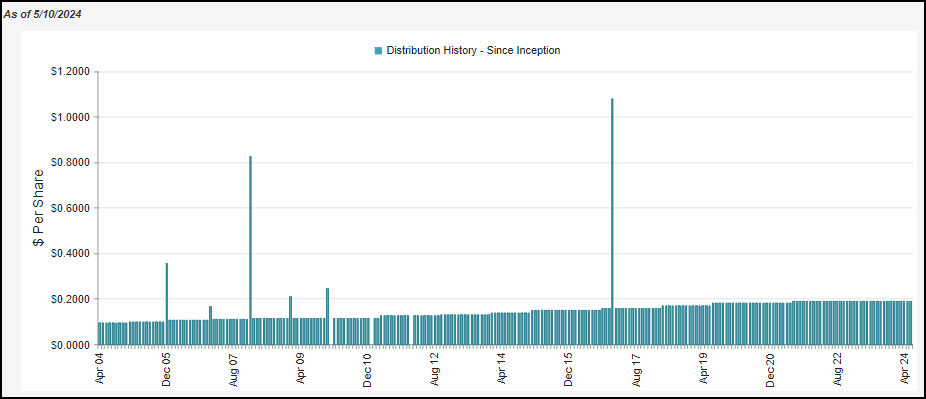
UTG could similarly benefit from a decrease in interest rates, as that would ease the borrowing costs of the fund; the underlying portfolio of utilities should also naturally benefit from a lower rate environment. However, with an NAV rate of around ~8%, we are looking at a generally more sustainable level in terms of being able to maintain the current distribution going forward.
I certainly don’t expect to see the fund increase its distribution like they were doing more regularly in a zero-rate environment, but one can create their own ‘growth’ by reinvesting a portion of the distribution. That’s just more of a common-sense thing that most investors should be doing anyway; even income investors living on their distributions and dividends should reinvest even a small portion. That helps out with combating the rising cost of living from inflation and potentially future distribution/dividend cuts from investments.
The fund is currently trading at a slight premium. That hasn’t been uncommon for quite a few years now, but it is worth noting that it wasn’t always the case. There had been periods of time when the fund traded at a substantial discount.
UTG Discount/Premium History (CEFConnect)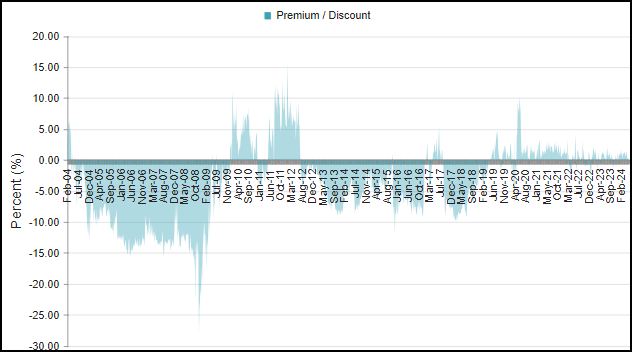
Conclusion
Today, we looked at the 6 closed-end funds that specifically came to market prior to the 2008/09 Global Financial Crisis with no cuts. Dividends and distributions are never guaranteed from investments, and companies can pay for an incredibly long time with no cuts.
In fact, we’ve seen a couple of dividend kings fall lately. Those are companies that have paid out increasing dividends for over 50 years. Leggett & Platt (LEG) and 3M (MMM) are the latest examples; 3M had a spin-off, but the adjusted dividend was reduced further than what the adjustment would have called for. The new payout was set based on 40% of adjusted free cash flow.
LEG has been facing earnings that have been falling meaningfully for the last several years now. They cut as their dividend payout became increasingly higher, beyond their EPS and also most of their free cash flow. This effort is to help strengthen their balance sheet and focus on debt.
With that, it is not only wise to rely on a fund or company that has never cut, but also to try to determine whether it can be maintained going forward.
When looking at that, I believe GOF is at the most risk. With a premium that’s starting to run on the higher end again, it doesn’t have a lot going for it today besides the “it has never cut” argument.
DNP would be another one I’d be cautious about as well, but the premium for this fund has been coming down, which makes it a bit easier to digest today. Both GOF and DNP would benefit from rate cuts, and given their already long history of no cuts, I suspect neither management team would be too quick to cut. So, there certainly is a path for these funds to possibly keep their records intact.
The question becomes whether it is too late and beyond the point of no return in terms of the NAV declines or if the funds can see turnarounds; that’s the question only time will be able to answer. In the case of GOF, it would need an epic turnaround. For DNP, I don’t think we are necessarily at that point yet, but the longer we are in this “higher for longer” period, the more cautious I will become.
PCN and UTG are both funds that I’d lean towards being probably fine from any distribution cuts for the foreseeable future. Things would probably have to deteriorate materially before making me too worried. That said, their valuations also don’t make them screaming buys.
That leaves GLU and BME, with neither of these looking particularly at risk in terms of distribution cuts. The share price discount to NAV also makes them look more appealing on a relative basis.
Editor’s Note: This article covers one or more microcap stocks. Please be aware of the risks associated with these stocks.