
magical_light
The overall BDC space has relatively recently become subject to multiple headwinds that either limit further growth or, in most cases, introduce a significant pressure to shield the results achieved so far.
Yet, if we look at the total return statistics of BDC market index like VanEck BDC Income ETF (BIZD), we will not observe severe corrections. There is some drop, but in the context of a ~ 3-year bull run, it might just as well be interpreted as a healthy and temporary correction before next highs are achieved.
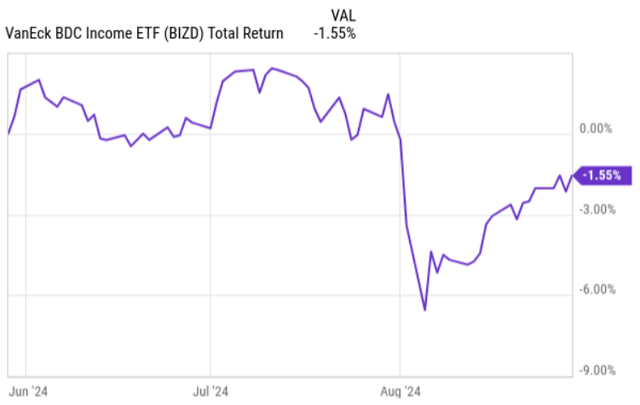

YCharts
It is also a similar picture to Putnam BDC Income ETF (NYSEARCA:PBDC), which is another popular BDC index.
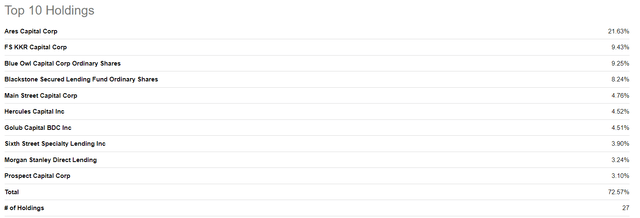
The thing that we have to understand here is that, as the BDC sector is small, consisting of ~ 45 securities of which many are illiquid, these ETF vehicles fail to capture the overall or systematic sector dynamics.
The Top 10 holdings of BIZD reflect this nicely, where the largest 10 positions account for ~ 73% of the total exposure.

Seeking Alpha
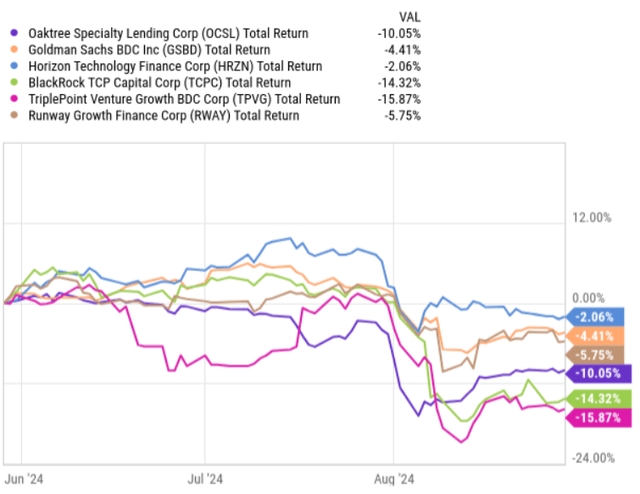
So, if we take a look at the chart below, we will notice that there have been actually many BDCs that have been trading at a deeper negative return territory (these are only selected examples, not exhaustive).

YCharts
If I had to select three most notable elements that currently put a pressure on BDCs, these would be the following:
- Spread compression stemming from increased supply of private credit actors and relatively subdued M&A / capital market activity. Namely, each newly issued or refinanced loan yields less and less compared to the levels that BDCs were able to achieve a couple of quarters ago.
- Strengthening of a scenario in which the Fed starts to cut interest rates. While this has no immediate impact on BDCs, it plays a role through the valuations and ability for BDCs to keep delivering strong total returns.
- And perhaps the most crucial element – increased corporate distress. This is something we have seen taking place for many BDCs, where their non-accrual positions have clearly gone up making, which is especially painful for BDCs that carry elevated leverage levels.
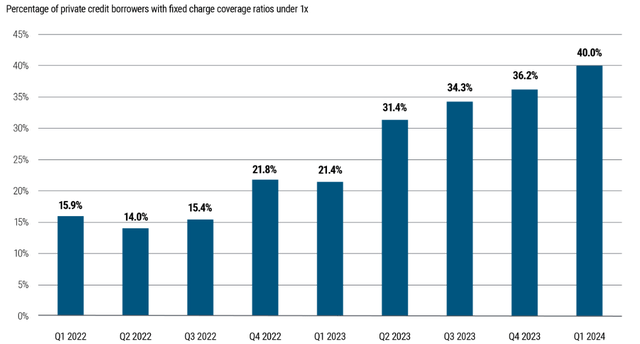
In the chart here we can see the explanation of why there has been an increase of non-accruals in a quite systematic fashion. Namely, many of underlying BDC investment companies have started to exhibit tougher challenges of servicing their borrowings due to factors such as gradual refinancing of previously assumed cheaper interest rate debt, lower consumer spending level and, in general, weakening economy.

Allianz Asset Management of America LLC
As a result of these dynamics, BDC Q2, 2024 earnings season brought some interesting data points from which it is worth extracting at least three important key takeaways or lessons learned – especially from those BDCs that have suffered.
#1 Portfolio weighted average statistics may send false signals
Oaktree Specialty Lending (NASDAQ:OCSL) delivered weak Q3, 2024 (keep in mind that OCSL has a bit different fiscal period where April – June period translates to Q3). While the adjusted net investment income per share did not decline that much (just by $0.01), the fact that this metric landed at $0.55 per share implies fully exhausted dividend coverage. Namely, the current dividend coverage based on Q3 earnings and distributions stands at 100%, which leaves no margin of safety at all. Problems get even worse if we consider the negative momentum in the net investment funding activity, margin compression and quality front.
Speaking of the quality, Q3, 2024 provided (at least for me) a valuable lesson.
In the recent earnings package, OCSL reported significantly rising non-accruals, which led to a notable NAV per share reduction – from $18.72 in the previous quarter to $18.19 now. The non-accruals continued to increase, reaching 5.7% of the total portfolio value (cost basis terms), which is clearly above the sector average and a huge driver behind the depressed share price.
Yet, prior to the publication of Q3, 2024 earnings report, I issued a relatively bullish piece on OCSL projecting that the non-accruals will gradually normalize due to a really strong credit statistics at the underlying portfolio level. For instance, OCSL carried a well-capitalized investment company structure with, say, software portfolio company LTV at only 41% and the interest rate coverage ratio at 1.9x. These metrics could be easily put in the top quartile of the highest quality portfolios. Plus, the portfolio company median EBITDA stood at $147 million, which implicitly provides an additional protection as there is no tiny cap or non-cash generating business exposure.
However, despite these nuances, OCSL continued to register incremental non-accruals in a meaningful fashion.
The lesson here is that investors have to be very careful on basing their investment decisions (or quality judgments) on the portfolio weighted average metrics. Although the weighted average method allows capturing the core essence nicely, we have to keep in mind that there could be a speculative concentration of assets in the bottom size quartile. Since BDCs rely so much on external leverage, which magnifies both the upside and downside, each percentage point that is placed under the non-accrual position renders a notable impact on the BDC business (as we saw above with the NAV decline).
#2 Idiosyncratic write-offs might turn out to be systematic
BlackRock TCP Capital Corp (NASDAQ:TCPC) is another BDC, which has done poorly over the Q2, 2024 period. It generated adjusted net investment income of $0.38 per share, which is significantly below the Q1, 2024 result of $0.45 per share. As a result of this, the dividend coverage level has declined to 112%, leaving no material headroom for protection against further downside risks.
Just as in the case of OCSL, the key reason behind this dynamic was the increase in the non-accrual base. In Q2, TCPC put additional six portfolio companies under non-accrual, which inflated the total non-accrual position to 10.5% of portfolio cost. This is massive and sufficient enough to offset the retained surplus after dividend distributions, leading to a NAV per share drop from $11.14 to $10.20 (on a quarter-to-quarter basis).
Looking at the portfolio level, we could theoretically arrive at a similar conclusion as we had it in OCSL’s case. For example, TCPC’s portfolio has just below 160 companies, from which 91% lies in the senior secured loan segment. Roughly 75% of the investments comprise less than 1% of the total income generation. On weighted average terms, the internal portfolio risk rating is 1.5x, which is indicative of a well-performing portfolio.
Yet, as described, the things have not worked out as well as one might have anticipated from these broad metrics.
The lesson here that I would like to extract is that investors should pay a close attention to the structural non-accrual dynamics and really dig deep to understand whether all of this is idiosyncratic or systematic.
Already in the previous quarter (Q1, 2024) we could observe quite elevated non-accruals. The comment on this by Raj Vig – Chairman and CEO – in the previous earnings call was that this could be deemed a one-off item:
The write-downs in the first quarter are mostly the result of circumstances specific to a handful of companies, and as we have stated before, we do not believe these situations are any indication of broader credit challenges in our portfolio. The majority of our portfolio companies continue to report revenue and margin expansion, with many generating sustained performance improvements.
The Q2, 2024 results obviously took a different path. Now, in Q2, 2024 earnings call we see a similar comment by Raj Vig:
While this increase is clearly notable and disappointing, it’s important to point out that, for the most part the change is due to a set of factors at each individual company level that are wholly-unrelated, but coincidentally converged this quarter to drive the non-accrual levels.
Luckily, once the previous quarter (Q1, 2024) package was released, I recognized additional risk zones in TCPC’s business such as forthcoming refinancing risk and subpar prospects on sourcing sufficient investment volumes to keep the asset base protected.
#3 Quality matters
The case with Goldman Sachs BDC (NYSE:GSBD) is rather conventional and more straightforward.
In Q2, 2024 GSBD generated net investment income of $0.59 per share, which implies an increase of 7.3% relative to the prior quarter. A more precise measure of the core cash generation – adjusted net investment income – experienced a favorable uptick of $0.03 per share, ending the quarter at $0.57. Based on this, the dividend coverage level remained healthy at 1.26x, which is clearly better than in OCSL’s and TCPC’s situation.
Yet, if we turn to the NAV per share statistics, we will notice a negative movement of 6% compared to Q1, 2024.
Just as in the case of previous two BDCs, the key source behind this dynamic was rising non-accruals, which have now increased to 7.6% (cost basis) from 3.3% in the prior quarter. Here it is really worth appreciating the magnitude of negative impact that stems from couple of hundred basis points in incremental non-accruals. Namely, the NAV per share dropped by 6%, while the adjusted NII increased by 7.3% and the dividend coverage remained supportive for ample capital retention.
As I outlined in on one of my previous articles on GSBD that was issued before the Q2, 2024 report, the BDC carried already too aggressive portfolio. For instance, the weighted average net debt-to-EBITDA stood at 6.1x, and the weighted average interest coverage was 1.5x. Both measures at these levels signal very tight leverage and coverage situation at the underlying portfolio company level. If we now remember the nuance of OCSL, where even greater risks could lie in the bottom quartile, then seeing these weighted average levels, we could only imagine what kind of balance sheets and cash flows are generated by these lower quality investments.
The key takeaway or lesson learned here is that quality matters, but given OCSL’s case – it is not a silver bullet.
The bottom line
Currently, BDCs are on average performing well, but given several fundamental headwinds, the future performance for many businesses operating in this space looks rather challenging.
The Q2, 2024 earnings season has revealed several important lessons that investors could digest now in order to prepare their portfolios for the upcoming pressures that could come from further spread compression, low M&A activity and, importantly, increased corporate distress levels in the private credit area.


