Jose Luis Pelaez Inc
The market remains near record highs after a red-hot run. It’s the best-ever presidential election year return and the 13th-best return for the S&P through the year’s first half.
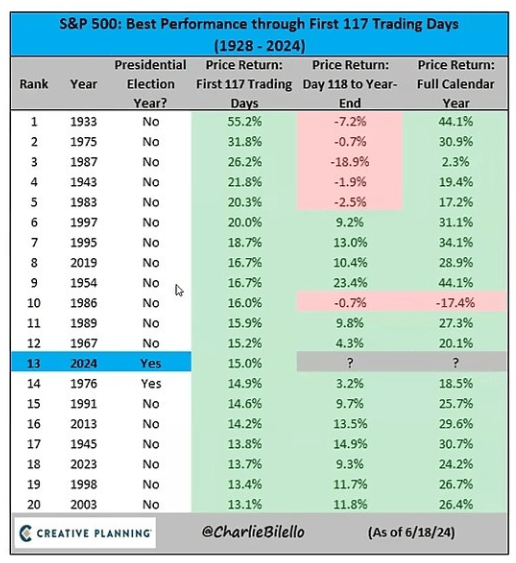

Charlie Bilello
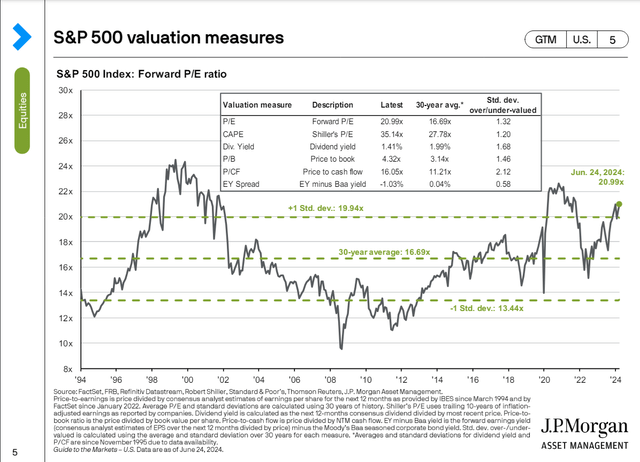
Naturally, many investors worry that stocks may potentially go into a bubble.

JPMorgan Asset Management
But which of these valuation metrics is best to use? After all, there’s a big difference between stocks being 42% undervalued and stocks being 112% overvalued.

Pacer Funds
Fortunately, there’s plenty of academic research on how different valuation metrics predict future and volatility-adjusted returns.
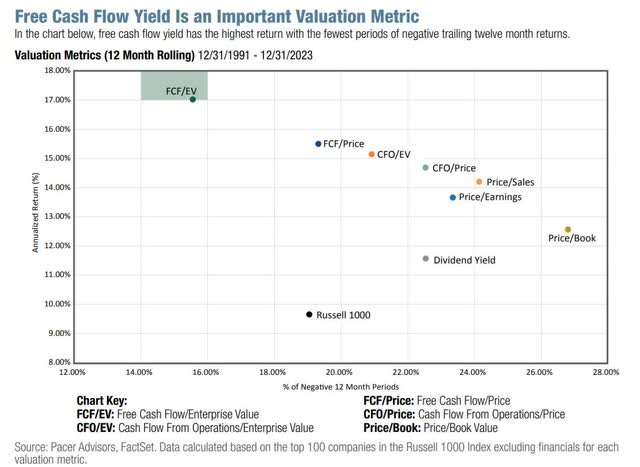
Since 1990, the best valuation metric has been free cash flow yield or FCF/enterprise value.
- Enterprise value = market cap + cash – debt (the net cost of acquiring the full company).
Is it any wonder Buffett is a fan of free cash flow, which he calls “owner earnings?”
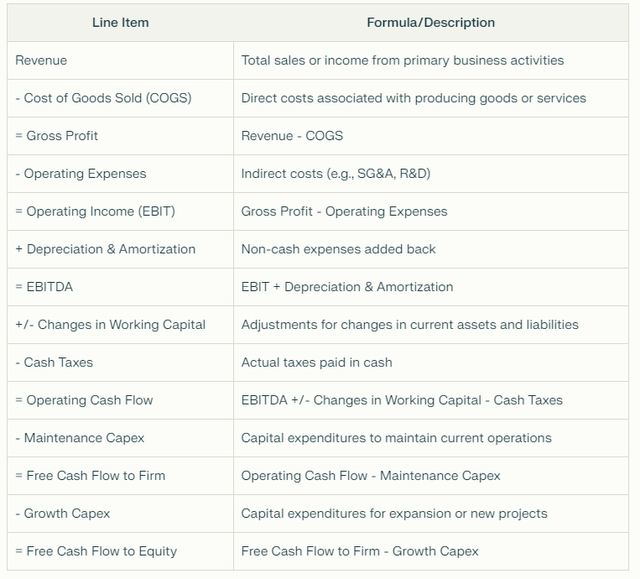
Free cash flow is left over after running the company and funding all future growth.

Perplexity
In other words, the owners can use it for whatever they want, such as acquisitions, paying down debt, buying back shares, or paying dividends.
Over the last decade, much debate has been about whether “value is dead” and whether we can value companies today using traditional valuation metrics like earnings, cash flow or sales.

Perplexity
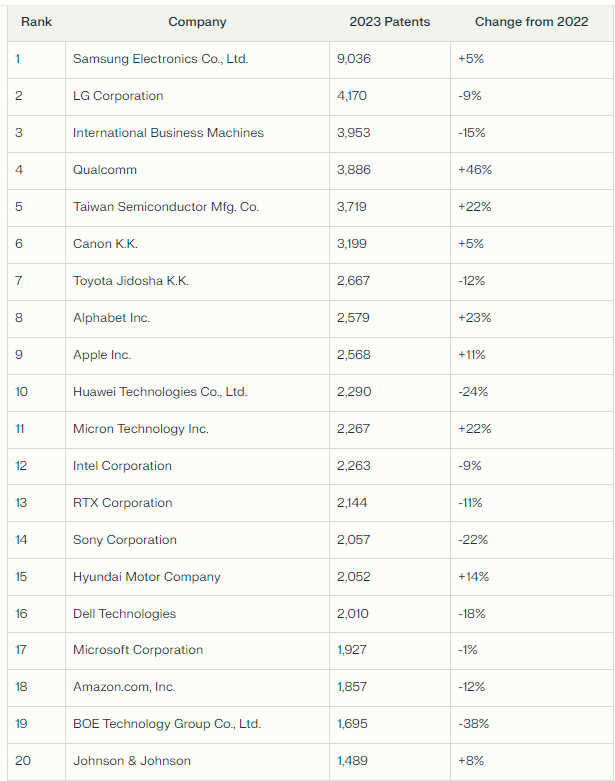
Companies like to refer to patents as “intangible assets,” which is one reason why traditional valuation metrics might not apply.
I would argue that a reasonable valuation metric will factor in all aspects of a company, as Ben Graham’s “weighing machine” factored in every critical component.
Sales are vanity, earnings are sanity, and free cash flow is reality.
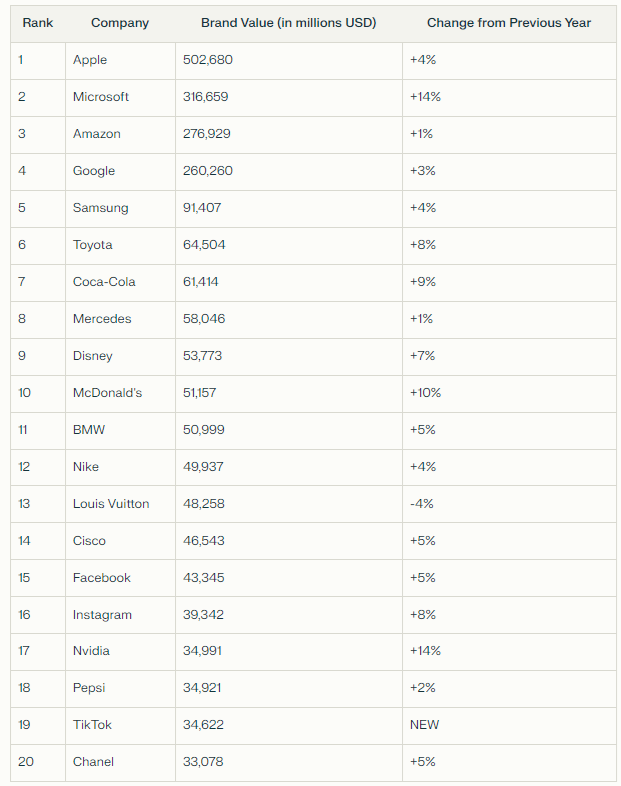
What’s the value of a brand? A patent? A corporate culture? The answer, from an investing perspective, is long-term free cash flow.
IBM’s (IBM) mountain of patents isn’t worth a penny unless it can generate free cash flow.
Apple’s (AAPL) brand and iOS ecosystem will be worth $500 billion if they generate free cash flow over time.

Interbrand 2023 Rankings (Perplexity )
How can we tell that free cash flow is a superior valuation metric? Should we take Buffett’s word for it?
In God we trust. All others bring data.” – Wiiliam Deming, American Statistician
Look at that historical valuation data and see how strong it is.

Pacer Funds
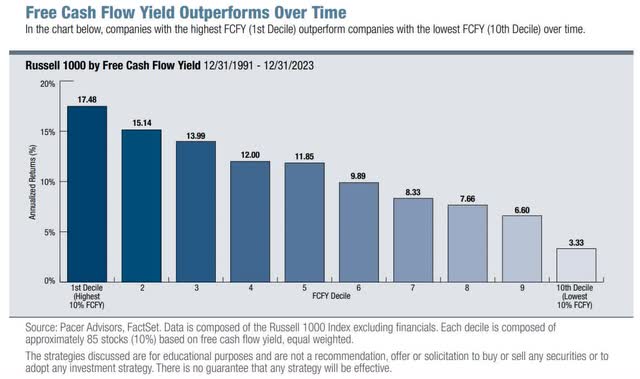
If you break out companies by decile, ranking all US stocks by free cash flow yield since 1990 and then ranking them by FCF yield every quarter, you can see a nearly perfect correlation between valuation and returns.
The 10% most expensive companies with the lowest FCF yields averaged 3.33% annual returns since 1990.
The 10% most undervalued companies, with the highest free cash flow yield, averaged 17.5% annual returns.
Free cash flow yield is a sign of value and quality since free cash flow margins are one of the most important profitability metrics, Wall Street’s favorite quality metric.
Historical COWZ Returns Confirm That “Value Investing Isn’t Dead”


Portfolio Visualizer Premium
Since January 2017, the Pacer Cash Cows ETF (COWZ), which uses FCF yield to select deep-value large-cap stocks, has delivered equal to slightly superior returns to the S&P and Russell 1000.
In a raging bull market where growth outperformed value for 16 years, value investors using free cash flow yield didn’t have to experience long periods of underperformance.
What About The Market Today? What Does Cash Flow Yield Tell Us?
| % Of Year Done | 2024 Weighting | 2025 Weighting |
| 50.00% | 50.00% | 50.00% |
| Forward S&P EV/EBITDA (Cash-Adjusted Earnings) | 10-Year Average | Market Overvaluation |
| 14.49 | 13.64 | 6.23% |
| S&P Fair Value | Decline To Fair Value | Fair Value PE |
| 5,148.46 | 5.87% | 19.51 |
(Source: Dividend Kings S&P Valuation Tool)
The good news is that stocks are historically only modestly overvalued, not the kind of 100%-plus premium bubbles you might have heard about.
Historical PEG Ratios
| Potential Overvaluation (10-Year Average) | S&P 10-Year Average Cash-Adjusted PEG | S&P Current Cash-Adjusted PEG |
| -30.62% | 1.77 | 1.23 |
| Potential Overvaluation (25-Year Average) | S&P 20-Year Average |
S&P Current Cash-Adjusted PEG |
| -49.26% | 2.42 | 1.23 |
(Source: Dividend Kings S&P Valuation Tool)
The market’s 25-year PEG ratio is 2.17, the 20-year average is 2.42, and the 10-year average is 1.77.
Today, it’s 1.23, indicating Peter Lynch’s “growth at a reasonable price.”
If and only if that expected growth of 11.8% Morningstar and FactSet from the S&P comes true.
- If earnings are missed by 50%, then the PEG ratio is 2.46, the 20-year average.
How This Can Help You Find The Best Buffett-Style Dividend Aristocrat Bargains
What if you could combine the power of free cash flow yield, which automatically combines quality with the most potent historical valuation metric, with the income dependability of dividend aristocrats?
Let’s find out!
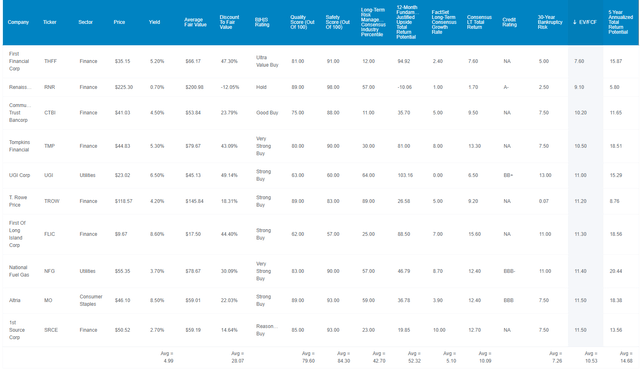
Let’s screen for the ten highest free cash flow yield dividend aristocrats, just like the COWZ ETF builds their portfolios using no other screening criteria.
The Preliminary Screen: Some Issues Pop Up

Dividend Kings Zen Research Terminal
If you screen by FCF yield alone, there are a few problems. The first is that you end up with mostly financials, some of which are actually historically overvalued relative to their long-term valuation metrics.
Another problem is that they can get junk-bond-rated companies like UGI, which is speculative.
And some of these companies are so slow growing (like TROW) that despite very high free cash flow yields, just 8% annual returns are what the FactSet consensus expects over the next five years.
There are aristocrats with yields high enough to generate stronger returns over the next five years.
So what if we apply a bit of screening magic?
Let’s eliminate speculative companies, such as those with junk bond credit ratings.
Let’s eliminate anything that’s historically overvalued.
After all, what if a company’s 10-year average FCF yield is 10% and today it’s only 8%? That might show up as one of the top FCF yield aristocrats but it’s not a good buy.
What if we eliminate anything that isn’t expected to match Morningstar’s and FactSet’s 12% five-year consensus return potential for the S&P?
In other words, eliminate any non-investment-grade aristocrat who isn’t expected to match the market at least but likely beat it.
And finally, what if we select one aristocrat in each sector, the top FCF yielder that combines safety (credit rating, non-speculative) and growth rate (consensus five-year total return)?
Now we have a perfectly diversified portfolio of dividend aristocrats (champions, so non-US stocks are eligible), each one a wonderful combination of quality, income dependability, growth, and value.
9 Buffett-Style High-Yield Dividend Aristocrats
Buffett isn’t just famous for his love of value; Charlie Munger taught him the value of buying “wonderful companies at fair values.”
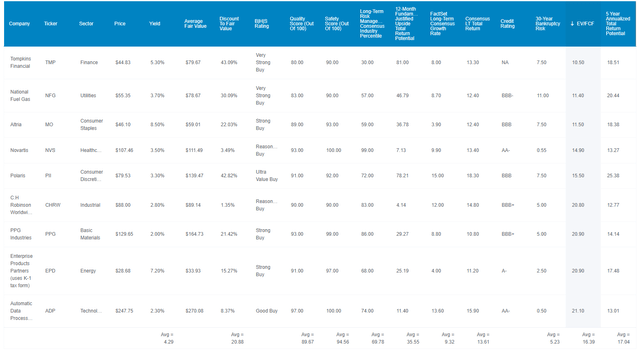
When we screen by sector and factor in growth to maximize long-term income growth, we get a 10-sector Buffett-style aristocrat portfolio based on FCF yield.

Dividend Kings Zen Research Terminal
A 16.39 EV/FCF multiple represents a 6.1% FCF yield. How does that compare to the rest of the aristocrats and the stock market?
- US market: 30.9 EV/FCF = 3.2% FCF yield
- Aristocrats: 24.7 EV/FCF = 4.1% FCF yield
So basically, this FCF yield aristocrat portfolio is 2X better than the US market and 50% better than the aristocrats.
The yield is 4.3%, compared to Vanguard High-Yield (VYM)’s 3% and Schwab’s US Dividend Equity (SCHD) 4% forward yield.
So there’s your high yield.
A 21% discount to fair value is 27% better than the S&P 500, and the aristocrats are 8% undervalued, so their valuation is 19% superior.
The safety and quality scores of 95% and 90% indicate Ultra sleeps well at night and has an approximate risk of a dividend cut of 1% in a severe recession.
The 12-month fundamentally justified upside to fair value is 36%.
This is not a forecast, but if and only if all of these companies grow as expected and return to historical, market-determined, historical fair value, a 36% rally in the next 12 months would be 100% justified by today’s fundamentals as best we know them.
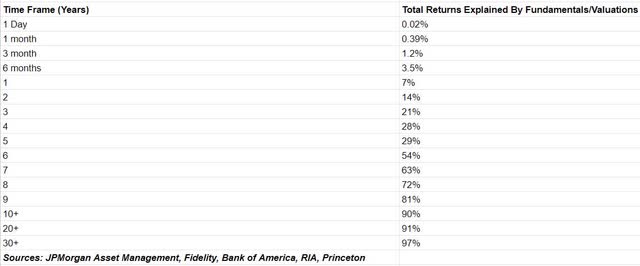
Over 12 months, 93% of returns are driven by momentum, luck, and sentiment, not fundamentals. So, substantial gains in any given year are technically primarily driven by luck.
With rare exceptions, such as Nvidia’s (NVDA) 7X increase in free cash flow in one year.
So, 4.3% yield + 9% to 10%% long-term growth consensus is a fantastic potential income growth portfolio, especially from a pure aristocrat portfolio.
The dividend growth forecast is 9% to 10% annually, potentially doubling every eight years.
If you reinvest the dividends, the income growth potential is 13% to 14%, the same as the total return potential.
The consensus five-year total return potential is 17% per year, 5% more than analysts expect from the S&P 500.
OK, this sounds pretty impressive, some very impressive aristocrats.
But what evidence do we have that these incredible future returns and income growth are reasonable?
Historical Returns Since 1998


Portfolio Visualizer Premium


Portfolio Visualizer Premium
The average rolling returns are 13% to 14%, just like analysts expect in the future.
That’s a lot more consistent returns than the S&P because the worst five-year return was 0%, while the market has experienced as much as 13 years underwater.


Portfolio Visualizer Premium
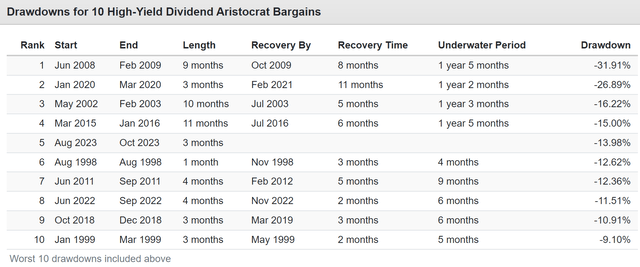
Most bear markets were milder, with fewer bear markets in general.

Portfolio Visualizer Premium
Note that these aristocrats are currently in a 14% correction market, which is why they are on sale, and I’m recommending them today.

Portfolio Visualizer Premium
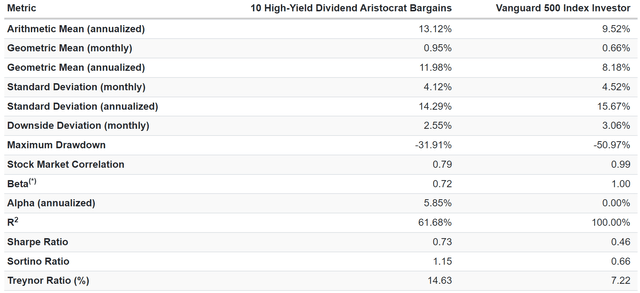
Beta is a measure of expected volatility compared to the S&P 500 based on historical correlation.
In other words, in the long term, a 0.72 beta aristocrat portfolio is expected to be about 72% as volatile as the S&P and earn 72% as much as the stock market.
The 6% annual alpha these aristocrats generated means they outperformed their expected returns by 6%, with nearly 2X the negative-volatility-adjusted returns of the S&P (Sortino ratio).
The Treynor ratio shows how much extra return an investment portfolio generates compared to a risk-free investment for each unit of market volatility it takes on. It helps investors understand if they’re adequately compensated for the market-related risk they’re assuming.
Here’s the historical context for some of these ratios.
| Investment | Beta (S&P) | Sharpe Ratio | Sortino Ratio | Treynor Ratio |
| ZEUS Family Fund | 0.49 | 3.23 | 20.77 | 54.19% |
| Harry Browne’s Permanent Portfolio | 0.25 | 0.73 | 1.21 | 21.18% |
| Ray Dalio’s “All Weather” Portfolio | 0.3 | 0.62 | 0.94 | 17.24% |
| 10 High-Yield Dividend Aristocrat Bargains | 0.72 | 0.73 | 1.15 | 14.63% |
| David Swenson Yale Endowment | 0.7 | 0.61 | 0.88 | 10.27% |
| 60-40 | 0.62 | 0.62 | 0.92 | 9.50% |
| S&P | 1 | 0.58 | 0.84 | 8.84% |
| Larry Swedroe Minimize FatTails Portfolio | 0.35 | 0.48 | 0.7 | 8.74% |
| Nasdaq | 1.29 | 0.44 | 0.64 | 8.07% |
| Meb Faber Ivy Portfolio | 0.74 | 0.31 | 0.42 | 5.53% |
(Source: Portfolio Visualizer)
This is a well-performing, low-volatility portfolio, delivering far better returns per unit of volatility.
And what about income? The key reason for owning aristocrat portfolios?
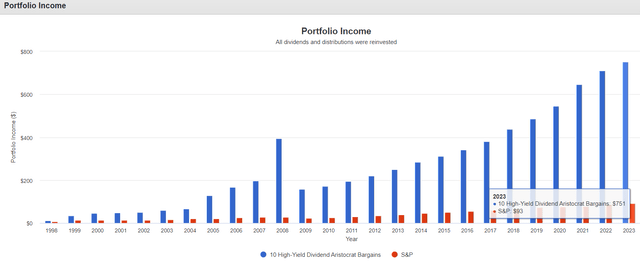
S&P Income Growth: 4.1%, Aristocrats: 13.8% For The Last 24 Years

Portfolio Visualizer
Total returns drive long-term income growth thanks to rebalancing.
13% to 14% annual returns transformed into 14% income growth, turning a 3.2% starting yield into a 75.1% yield on cost today.
But the good news is you don’t need to wait for decades for potentially attractive returns.
Consensus 2026 Total Return Potential
- Not a forecast.
- Consensus return potential.
- These are the expected returns if and only if these companies grow as expected and return to historical fair value by the end of 2026.
- Fundamentals would justify that.
Average: 81% =21.8% annually vs 35% or 12% annually S&P.
1-Year Fundamentally Justified Upside Potential: 36% vs 6% S&P.
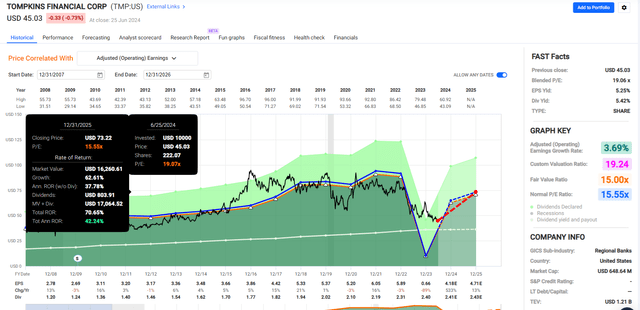
Tompkins Financial (TMP)

FAST Graphs, FactSet
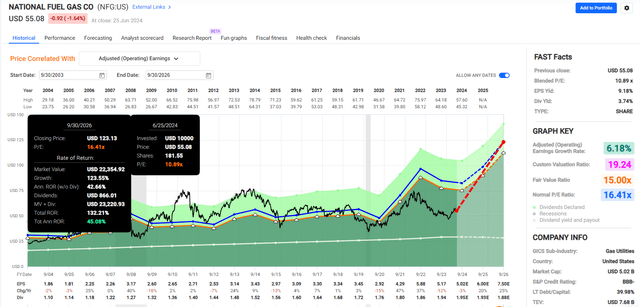
National Fuel Gas (NFG)

FAST Graphs, FactSet
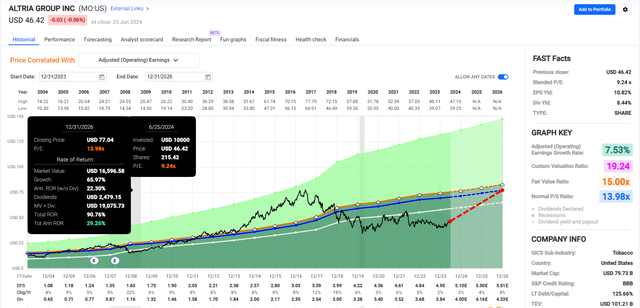
Altria (MO)

FAST Graphs, FactSet
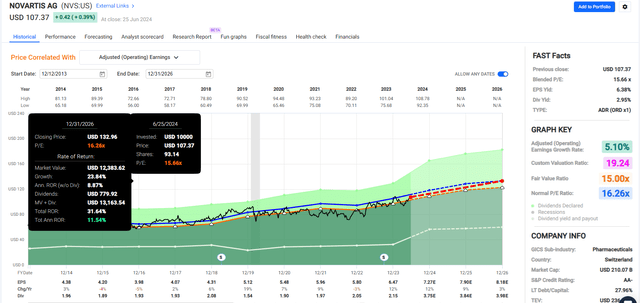
Novartis (NVS)

FAST Graphs, FactSet
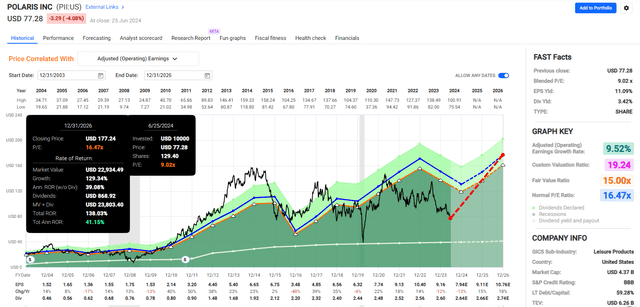
Polaris (PII)

FAST Graphs, FactSet
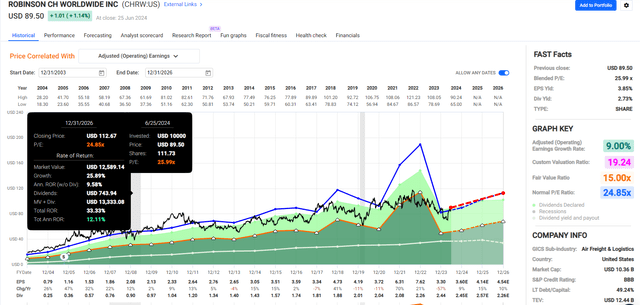
C.H. Robinson Worldwide (CHRW)

FAST Graphs, FactSet
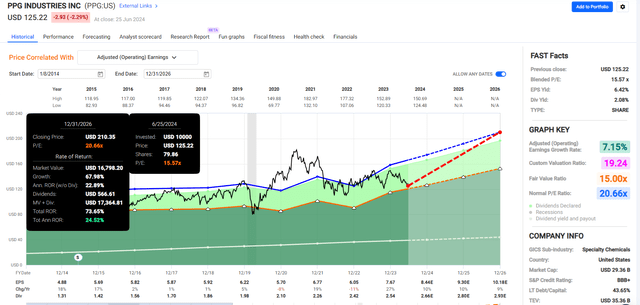
PPG Industries (PPG)

FAST Graphs, FactSet
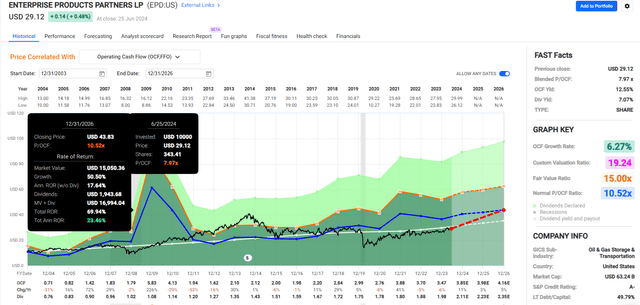
Enterprise Products Partners (EPD) – K1 tax form

FAST Graphs, FactSet
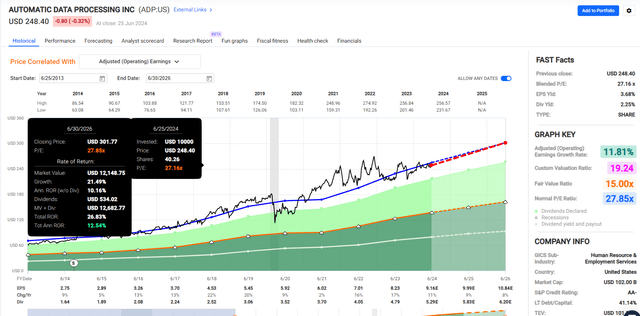
Automatic Data Processing (ADP)

FAST Graphs, FactSet
Risks To Consider
The biggest downside of free cash flow yield investing is that you’re focused on one particular metric that will change over time and potentially very quickly.

Ycharts
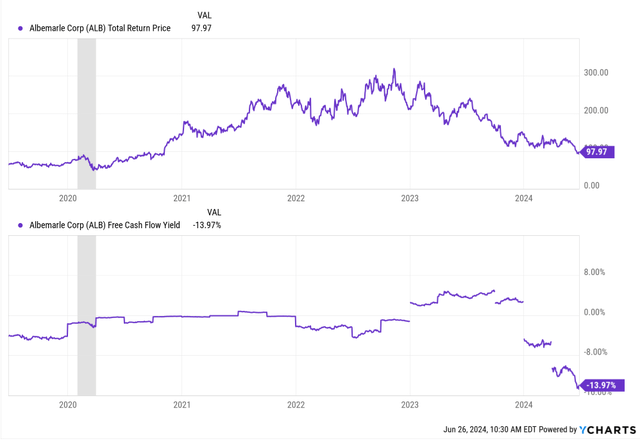
Albermarle (ALB) is a classic cyclical aristocrat warning story.
When lithium prices exploded to $80,000 per ton in 2022, its free cash flow soared, reaching a peak trailing FCF yield of 7%.
By then, the price was already down 50%, so investors might have bought with confidence based on FCF yield alone.
ALB is the global leader in low-cost lithium production, but the free cash flow yield has fallen deeply negative, and the price has declined rapidly.
Forward FCF estimates, as VictoryShares FCF Yield ETF (VFLO) uses in a blended approach of forward and trailing EV/FCF, are at risk of estimates changing rapidly.
ALB’s FCF estimates collapsed rapidly and are now soaring again.


FactSet Research Terminal
But those estimates are based on estimated lithium prices, which are historically volatile.
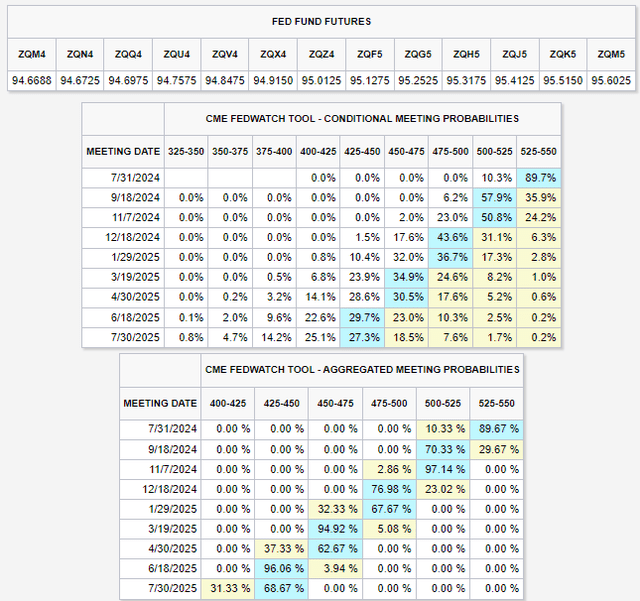
Many of these high FCF yield aristocrats are cyclical, smaller companies that do well in an accelerating economy with low interest rates.

FactSet Research Terminal
The bond market is 96% confident in four rate cuts within a year, but these estimates are volatile and can change rapidly with new economic data.
That 36% fundamentally justified return potential is not a forecast. It’s merely an estimate of what kind of return, if it happened, would be 100% justified by today’s best consensus estimates of fundamentals over the next 12 months.
If rates don’t come down, then growth rates for smaller companies such as these could disappoint, and they might not even generate positive returns.

DK S&P Valuation Tool
As JPMorgan and various other financial institutions point out, over the next 12 months, 93% of returns will be non-fundamentals-driven.
At least for portfolios and the stock market in general.
If any single company’s earnings double or are cut in half, then those price changes are driven by fundamentals, but the point is that even if you buy all the right things based on today’s data, the next year or even six years is a crap shoot.
In the short term, luck is 12X as powerful as fundamentals.
In the long term, fundamentals are 33X as powerful as luck.
Bottom Line: Consider These 9 Buffett-Style High-Yield Aristocrats If You’re Looking For Smart Blue-Chip Bargains In Today’s Overvalued Market
The market is near record highs; some stocks are in outrageous bubbles, and others are anti-bubbles.
It’s always and forever a market of stocks, not a stock market.
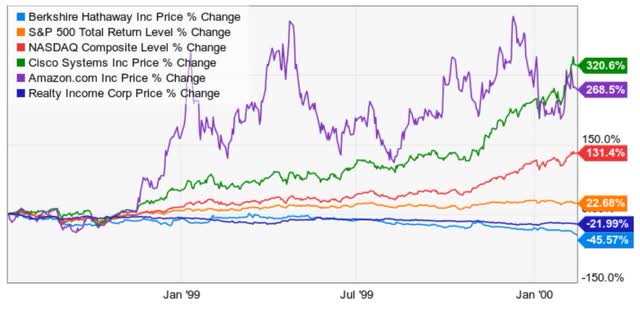
In the tech bubble, when stocks hit a historical premium of 50%, you could find many incredible bargains.

Ycharts
Look at how some of the world’s highest-quality dividend stocks, or even Berkshire (BRK.B), suffered during the last days of the tech bubble.

Ycharts
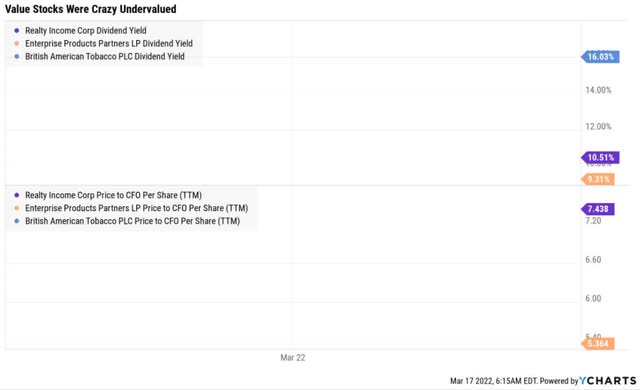
Great companies were trading cash flow multiples of 5X, with yields as high as 15% (Altria’s peaked at 43%).

Ycharts
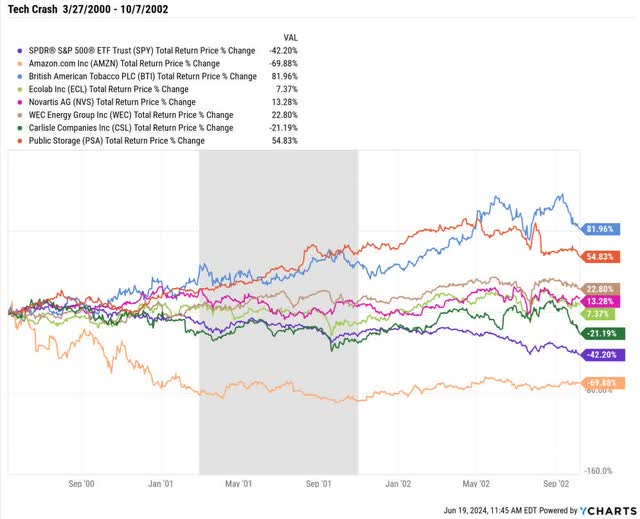
When the Nasdaq fell 82%, and the market was cut in half, many undervalued blue chips, including aristocrats, rose.
That doesn’t mean you should expect every value stock to increase in a bear market. But I want to point out that in March 2000, investors who thought, “There is nothing you can safely buy” were mistaken.
There’s always something you can safely buy if you remember to focus on safety and quality first, prudent valuation, and sound risk management.


