masterSergeant/iStock via Getty Images
Jane’s retirement portfolio continues to close the gap when it comes to our conservative estimate and more likely estimates of income produced. At the end of February, we conservatively estimated that Jane’s Traditional IRA income was going to be down by -18.9% year-over-year (YoY) and that her Roth IRA was going to be up .8% YoY. Looking at the updated numbers for March, these numbers have improved considerably to -16.3% and 2.4%, respectively.
One of the big drivers comes from the amount of money invested into liquid money market funds like Charles Schwab (SWVXX) and certificates of deposit. Due to the short-term nature of these investments I had excluded most of the income from the conservative estimates because my goal is to always under promise and over deliver rather than the other way around. At present, Jane has a total of $150,000 of her retirement portfolio invested in these instruments.
March Dividend Increases
It also helps that during the month of March a total of seven companies increased their dividend payout or provided a special dividend.
- Eaton (ETN) – Dividend increased by 9.3%
- Main Street Capital (MAIN) – Supplemental dividend of $0.30 per share
- 3M (MMM) – Dividend increased by .7%
- NextEra Energy (NEE) – Dividend increase by 10.2%
- Blue Owl Capital (OBDC) – Supplemental dividend of $.08 per share
- T. Rowe Price (TROW) – Dividend increased by 1.6%
- The Williams Companies (WMB) – Dividend increased by 6.1%
All of these increases contributed to the growth in income in both the Traditional and Roth IRAs.
Traditional IRA – March Trades
We had only two trades during March, with one being the sale of a small number of high-cost shares for EOG Resources (EOG) and the other to add the First Carolina CD.
Traditional IRA – 2024-3 – Trades (Charles Schwab)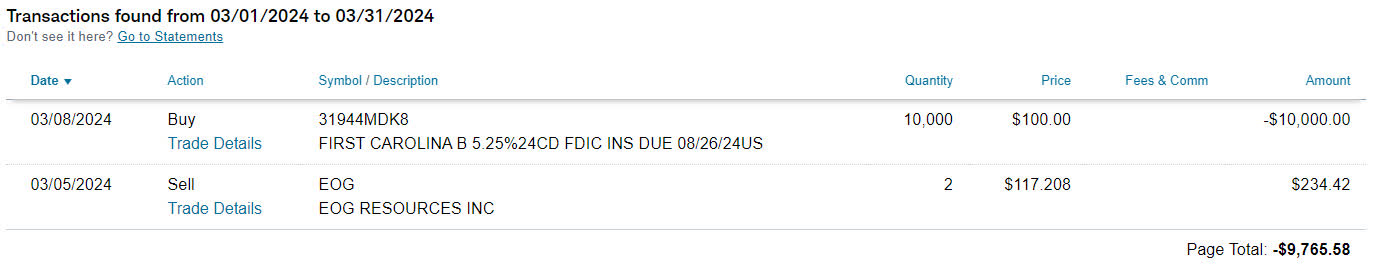
Roth IRA – March Trades
We had two trades in the Roth IRA for the month of March is well but these were a little bit more interesting with regard to the purpose behind making the trade.
Roth IRA – 2024-3 – Trades (Charles Schwab)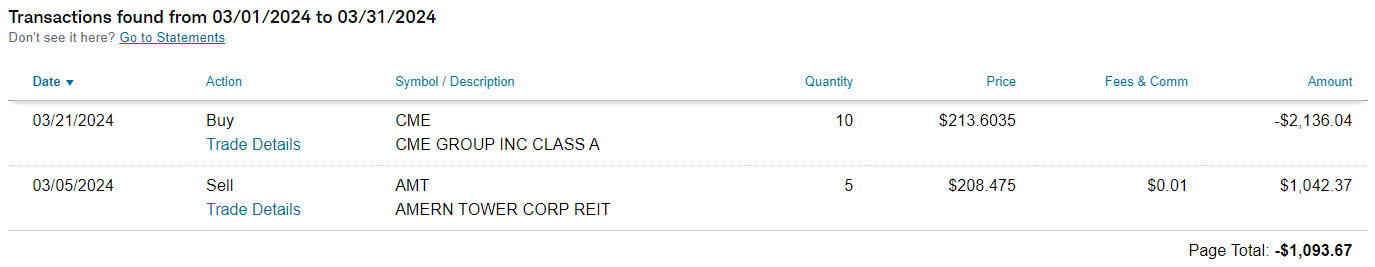
CME Group (CME) is the most recent add to the Roth IRA and I provided a quick breakdown of the logic/reason why we chose to add it in last month’s article The Retiree’s Dividend Portfolio – Jane’s February 2024 Income Update.
The footnotes rationale is that CME is an excellent company that sees benefits from volatility and that increases the potential to generate outsized returns in addition to the fact that the company is very shareholder friendly.
The sale of American Tower (AMT) shares a strong opportunity to lower the overall cost basis, which based on today’s prices, reinforces the decision to keep pushing the cost basis lower. In the month of April, we have started to add to AMT now that we have pushed lower into the $170/share range.
Portfolio Composition
The images below are focused on what is happening now and moving forward.
The first image shows what has happened year-over-year with the portfolio in terms of which holdings are generating income.
Traditional IRA – 2023 V 2024 – March Dividends (CDI) Roth IRA – 2023 V 2024 – March Dividends (CDI)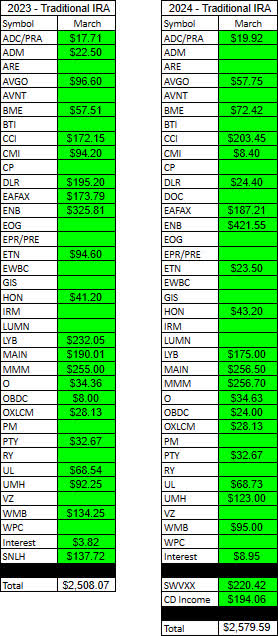
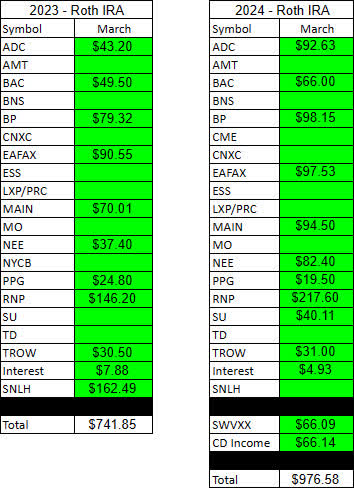
Here is an updated table of the extremely conservative forecast that suggests income will be down -16.3% (previously -18.9%) in the Traditional IRA and up 2.4% (previously .8%) in the Roth IRA for FY-2024. Remember, these numbers look bleak because it assumes that we see no dividend growth, and we do not capitalize on the additional income from CD’s and Money Markets (which is something the Traditional IRA is extremely dependent on).
2024-3 Jane’s Retirement Income (CDI)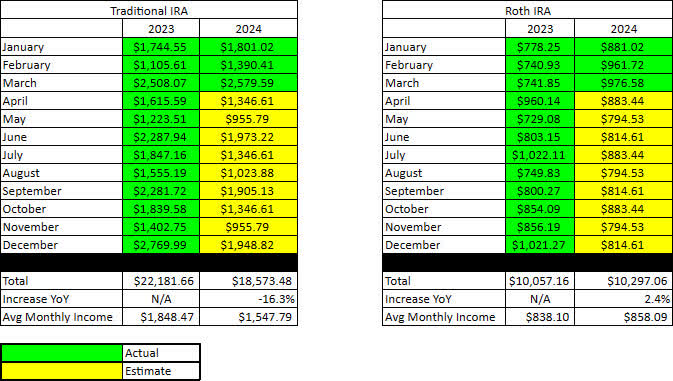
The next two images have been updated from my forecasting articles to look at how much the income has grown on a monthly basis and separates out what income is from dividends and what comes from CDs/Money Markets, etc.
This offers more insight/context as to where Jane’s income is being derived (equities, fixed income, etc). These are also more realistic numbers of what we expect to see for income growth and also gives us the ability to better track which months have the largest impact.
Here is a basic understanding of what each of the columns/fields mean:
- 2023 – Income results for 2023
- 2024 (Ex CDs) – Estimated income 2024 (yellow) and actual income 2024 (green) but excludes all income earned from money markets, CD’s, etc.
- 2024 (W CDs) – Estimated CD & money market income 2024 (yellow) and actual income 2024 (green). Separated because we want to differentiate between dividend income and growth compared to CD’s/money market that are not subject to increases.
- Total Income – Combined total income from dividends, CDs, Money market, etc.
- 3%/5%/7% Increase – These columns serve as a marker so you can see how much income would need to be hit that month to achieve a specific increase. I will likely change these numbers to be more account specific in the future (some accounts are growing more rapidly than others).
2024-3 – Traditional IRA Income & Forecast (CDI) 2024-3 – Roth IRA Income & Forecast (CDI)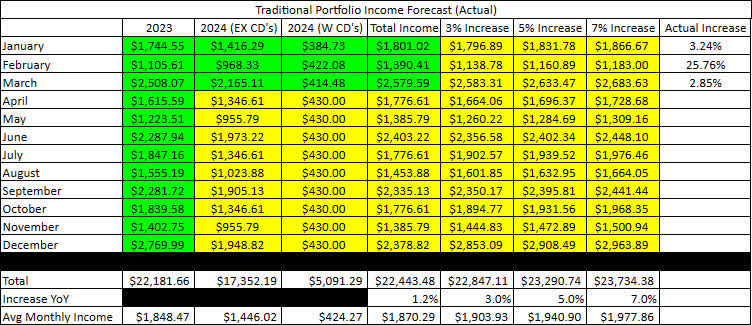

From the numbers above, we are expecting to see income growth of 1.2% in the Traditional IRA and 14.0% in the Roth IRA FY-2024. What these tables show us is that the Traditional IRA has considerably more income from CDs and money markets which is making it look as if it is significantly behind pace when using the conservative estimates (since interest income is excluded in the conservative estimates). The Roth IRA on the other hand appears to be on target to hit its growth expectations.
Portfolio Changes & Upcoming Trades
We do have some open limit trades in the Traditional IRA and Roth IRA’s but I am going to limit the focus to the most compelling/likely to execute trades.
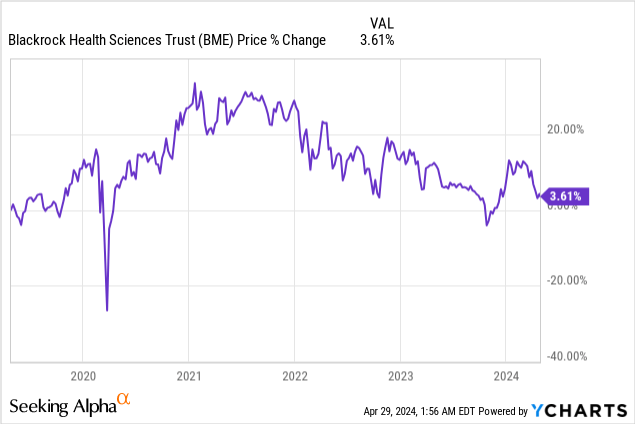
BlackRock Health Sciences (BME) – Open purchase of 20 shares at a limit of $38.50/share. We normally add shares in tranches of 10 shares each but with the recent drop in share price makes this a very compelling entry point given what we know about the historical valuation. Based on the last five years of BME stock valuation, the current price is on definitely on the lower end which means the potential to lock in more upside potential.
LyondellBasell (LYB) is an interesting example because I have limit trades set to trim the position back if share price should previous position is $105/share or higher while also having a limit trade to increase the position if the stock price drops to $92/share. LYB is a core position in Jane’s portfolio and we have already trimmed back the high cost shares (about 25% of the position). The Q1-2024 beat creates some upside potential but there is a case for the stock price to experience some weakness due to the Q2-2024 soft guidance.
NextEra Energy (NEE) has continued to make a steady recovery but we are now looking to trim back the high cost shares after adding shares in the mid-$50/share range. We recently had a long-standing open limit trade for 15 shares close at $70/share which reduced the size of the position by about 10%.
Conclusion
Jane’s portfolio is on the right track for income with all three months (January, February, and March) reflecting increases in income year-over-year with no months registering a loss or reduction compared to 2023. With a strong portfolio and the heavy investment into certificates of deposit we are feeling confident about the trend of Jane’s income for the remainder of 2024.
A couple of important factors to consider moving forward are the recently improved attractive value of fixed income products now that the market is actually pricing in that the Fed isn’t going to implement interest rate reductions without first seeing the changes that they are looking for. as a result of this, we are looking to put a mix of funds into Charles Schwab Money Market (SWVXX) and open up CD’s that range anywhere from 6-12 months because we are looking at yields between 5.25-5.50%. If you are concerned that interest rate cuts will happen sooner than later you might want to look at some of the longer-term brokered CD’s offering yields in the same range for the next three years.
In addition to our concerns about the finance sector, discussed in the March Taxable Account article (we recently reduced the size of our Bank of America (BAC) position) we are also looking to exit the apartment REIT sector because I am concerned about the negative impact inflation will have on the average consumer’s ability to afford rent. Rent and mortgage expenses remains stubbornly high and even as new apartment complexes continue to go up the number of units that are going unfilled also seems to be rising. We are now hearing about deals where you get the first month free on a $2500/month rent that requires three single people to live together just to make it affordable. The key issue I see here is that we aren’t in a place yet where these companies see enough of an issue to stop the project halfway through so there is still months of inventory that will be coming through soon enough. Combine this with mortgage application levels that are the lowest since the mid-90’s and we can see how multiple factors would contribute to the perfect storm.
John and Jane’s portfolios have very little exposure to apartment REITs and the only holding was a total of 10 shares in Essex Property Trust (ESS) that was acquired at a rock bottom cost basis. We have since exited this position altogether and shifted the proceeds towards a more compelling combination of value that we see in Lamb Weston (LW) and Americold Realty (COLD). I’ll discuss this a little more in the next article and I apologize for the delay but I recently had carpal tunnel surgery and it took me out for over the last week.
What stocks are you seeing that aren’t in Jane’s Retirement portfolio? Are there any compelling investments I should be looking at that? I would love to hear any ideas/suggestions in the comment section.
John and Jane are long all holdings mentioned in this article.