JHVEPhoto
In our previous analysis, we discussed STMicroelectronics N.V.’s (NYSE:STM) leading position in the SiC market. Despite facing stiff competition, particularly from Infineon, which has made strides in performance with its expanded 2kV CoolSiC portfolio, we believe STMicro has shown remarkable growth over the past 4 years, outpacing the overall SiC market with an average growth rate of 40%.
In this analysis, we focused on its MCUs which are under its Microcontrollers and Digital ICs Group (‘MDG’) segment as it is its second largest segment (31% of total revenues) and is the second fastest growing segment with an average of 10.5% in the past 9 years as seen below. We analyzed the company’s market positioning as its market share has risen over the years to become the market leader. We delved into factors why the company has been gaining market share by examining its competitiveness in the automotive and non-automotive MCU markets by product breadth and performance.
|
STM Revenue Breakdown by Product Type ($ mln) |
2015 |
2016 |
2017 |
2018 |
2019 |
2020 |
2021 |
2022 |
2023 |
Average |
|
Automotive and Discrete Group (ADG) |
2,731 |
2,813 |
3,059 |
3,556 |
3,606 |
3,284 |
4,350 |
5,969 |
7,848 |
|
|
Growth % |
-5.7% |
3.0% |
8.7% |
16.2% |
1.4% |
-8.9% |
32.5% |
37.2% |
31.5% |
12.9% |
|
Analog, MEMS and Sensors Group (‘AMS’) |
1,851 |
1,847 |
2,613 |
3,154 |
3,299 |
3,892 |
4,587 |
4,911 |
3,991 |
|
|
Growth % |
-1.4% |
-0.2% |
41.5% |
20.7% |
4.6% |
18.0% |
17.9% |
7.1% |
-18.7% |
9.9% |
|
Microcontrollers and Digital ICs Group (MDG) |
2,292 |
2,285 |
2,646 |
2,940 |
2,638 |
3,030 |
3,802 |
5,228 |
5,431 |
|
|
Growth % |
-3.6% |
-0.3% |
15.8% |
11.1% |
-10.3% |
14.9% |
25.5% |
37.5% |
3.9% |
10.5% |
|
Others |
23 |
28 |
29 |
14 |
13 |
13 |
22 |
20 |
16 |
|
|
Growth % |
-90.9% |
21.7% |
3.6% |
-51.7% |
-7.1% |
0.0% |
69.2% |
-9.1% |
-20.0% |
-9.4% |
|
Total |
6,896 |
6,973 |
8,348 |
9,664 |
9,556 |
10,219 |
12,762 |
16,129 |
17,286 |
|
|
Growth % |
-6.9% |
1.1% |
19.7% |
15.8% |
-1.1% |
6.9% |
24.9% |
26.4% |
7.2% |
10.4% |
Source: Company Data, Khaveen Investments
Rising MCU Market Share
Firstly, we examined the overall MCU market growth and the company’s market share trend.
|
MCU Global Market Revenue ($ bln) |
2015 |
2016 |
2017 |
2018 |
2019 |
2020 |
2021 |
2022 |
2023E |
8-Year Average |
|
Total MCU Market |
16.0 |
15.0 |
16.8 |
17.5 |
17.5 |
17.3 |
21.9 |
26.9 |
25.9 |
|
|
Growth % |
-5.9% |
12.2% |
3.7% |
0.2% |
-1.1% |
26.6% |
22.8% |
-3.8% |
6.8% |
|
|
STMicro MDG Segment |
2.3 |
2.3 |
2.6 |
2.9 |
2.6 |
3.0 |
3.8 |
5.2 |
5.4 |
|
|
Growth % |
-0.3% |
15.8% |
11.1% |
-10.3% |
14.9% |
25.5% |
37.5% |
3.9% |
12.3% |
Source: Omdia, Company Data, Khaveen Investments
Based on the table above, the MCU market has an 8-year average growth of 6.8%. The market growth surged in 2021 and 2022 with strong double-digit growth above 20% in those years as the broader semicon market surged amid chip shortages. In comparison, STMicro’s MDG segment, consisting of its MCUs and security ICs, RF and memory chips, grew at an average almost double the total MCU market (12.3% vs 6.8%).
Omdia, Khaveen Investments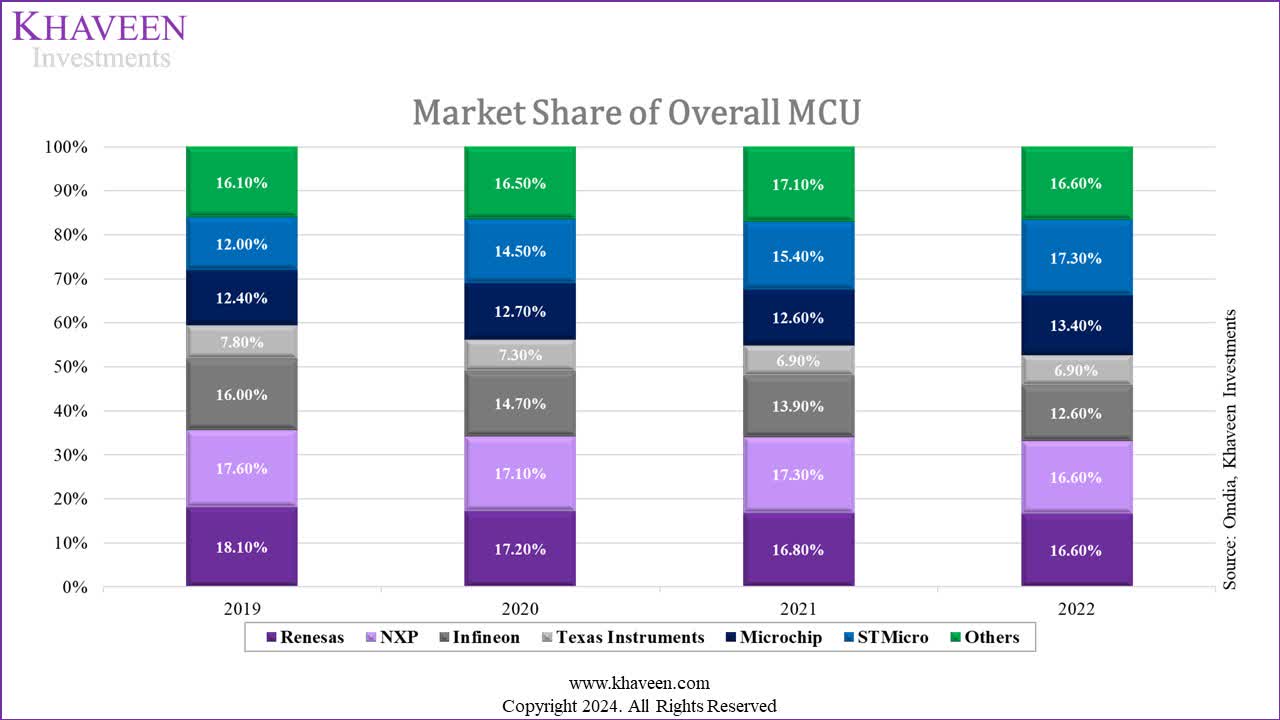
Furthermore, in the MCU market based on available compiled data between 2019 and 2022, the company with the best market share performance is STMicro which gained market share from 12% to 17.3% over the period, allowing it to become the market leader, followed by Microchip (MCHP) while the rest of its top competitors market share also declined slightly. TI’s (TXN) share had also declined slightly from 7.8% in 2019 to 6.9% in 2022. While TI’s market share had been declining, competitors Renesas (OTCPK:RNECF) and NXP (NXPI) had worse performance, as their shares dropped more than TI and are larger established players.
Yole Development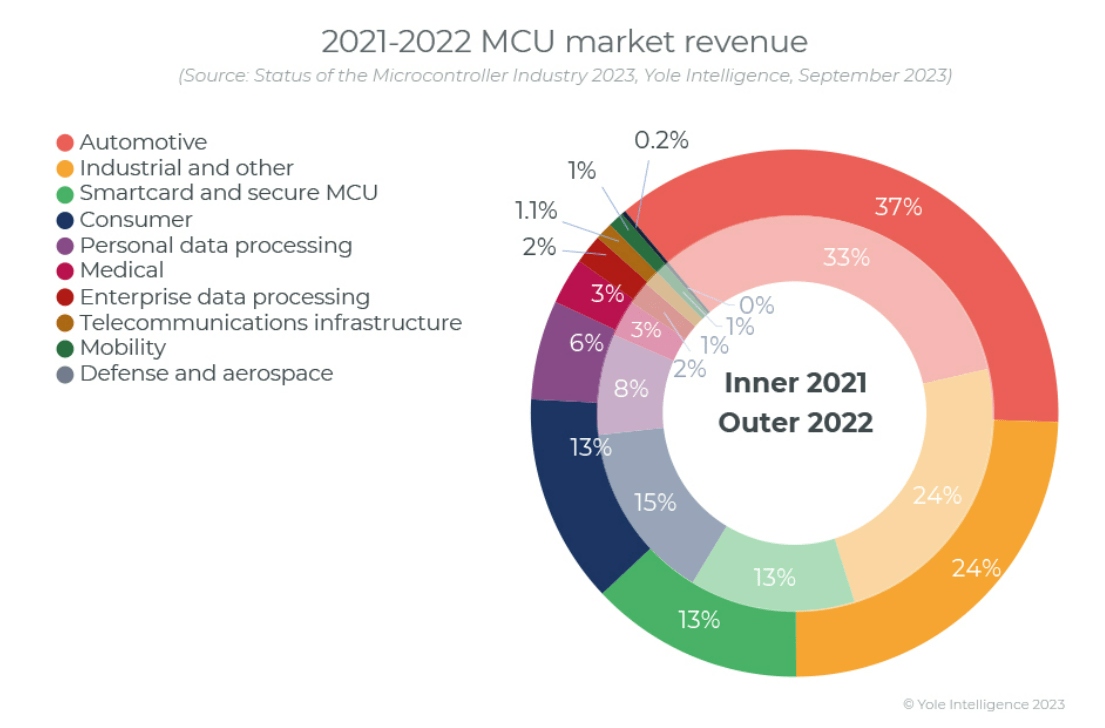
The MCU market is broken down into end markets in the chart above. The automotive end market is the largest, accounting for 37% of the total MCU market and increased by 4% compared to 2021, indicating strong growth within the automotive market. The second largest is Industrial and others accounting for 24% of the market followed by Smartcard and secure MCU and then Consumer with 13% share respectively. The smaller end markets include Personal data processing, Medical, Enterprise data processing, Telecommunications infrastructure, Mobility and Defense and Aerospace, accounting for the remaining 13% of the MCU market. We examined the market growth drivers of the main MCU markets below.
Automotive
In our previous analysis, we highlighted the increasing demand for comfort and safety in vehicles resulting in automakers integrating MCUs, which manage various functions ranging from air conditioning to braking systems. Also, the increasing complexity of vehicle features, from airbags to advanced driver assistance systems, leads to a rising number of MCUs per vehicle which the trend is expected to continue as new technologies including blind-spot detection and adaptive cruise control, become standard in modern vehicles. The automotive MCU market forecast CAGR is 8.92% based on Mordor Intelligence.
Industrial
According to Mordor Intelligence, the demand for MCUs in the industrial segment is increasing due to rising automation where MCUs are essential in this automation drive. Additionally, manufacturers also integrate remote features into their supply chain for real-time monitoring with the advent of Industry 4.0, increasing sensor usage and data monitoring for industrial processes, supporting the increasing demand for MCUs.
Smartcard Readers
The smartcard reader MCU demand is driven by developments in the end market of smartcard RFID and NFC technologies, especially in contactless smartcards. These smartcards are used in daily transactions such as for the transportation and security industry. According to Mordor Intelligence, the smart card MCU has a forecast CAGR of 5.29%.
Consumer
The demand for MCUs in the consumer market is driven by the adoption of consumer electronics like smartphones, smart home devices, wearables, and gaming consoles which require MCUs to manage various functions including data processing and interfacing with sensors.
Outlook
Overall, we believe STMicro stands to capitalize on the growth MCU market as the market leader, which has a market forecast CAGR of 7.6%, driven by factors such as the rising adoption of MCUs across automotive, industrial, smartcard security and consumer applications. However, STMicro’s MCU revenues from automotive are comparatively lower compared to the market breakdown for automotive (37%), indicating its greater focus on non-automotive MCUs. We also highlighted STMicro’s outperformance in the MCU market, indicating it has a competitive advantage as its MDG segment growth outpaced the MCU market and its market share has risen the most among competitors to achieve its place as the market leader. Thus, in the next point, we examined its competitiveness.
|
STMicro MCU Revenues |
STMicro Revenue ($ bln) |
STMicro Share of Revenue |
|
Automotive |
0.9 |
19% |
|
Non-Automotive |
3.8 |
81% |
|
Total |
4.7 |
100% |
Source: Company Data, Omdia, Khaveen Investments
Improving Competitiveness in Automotive MCUs
The automotive MCU is significant as it accounted for 37% of the total MCU market revenue. We examined STMicro’s performance in the automotive MCU market compared with competitors.
TechInsights, Khaveen Investments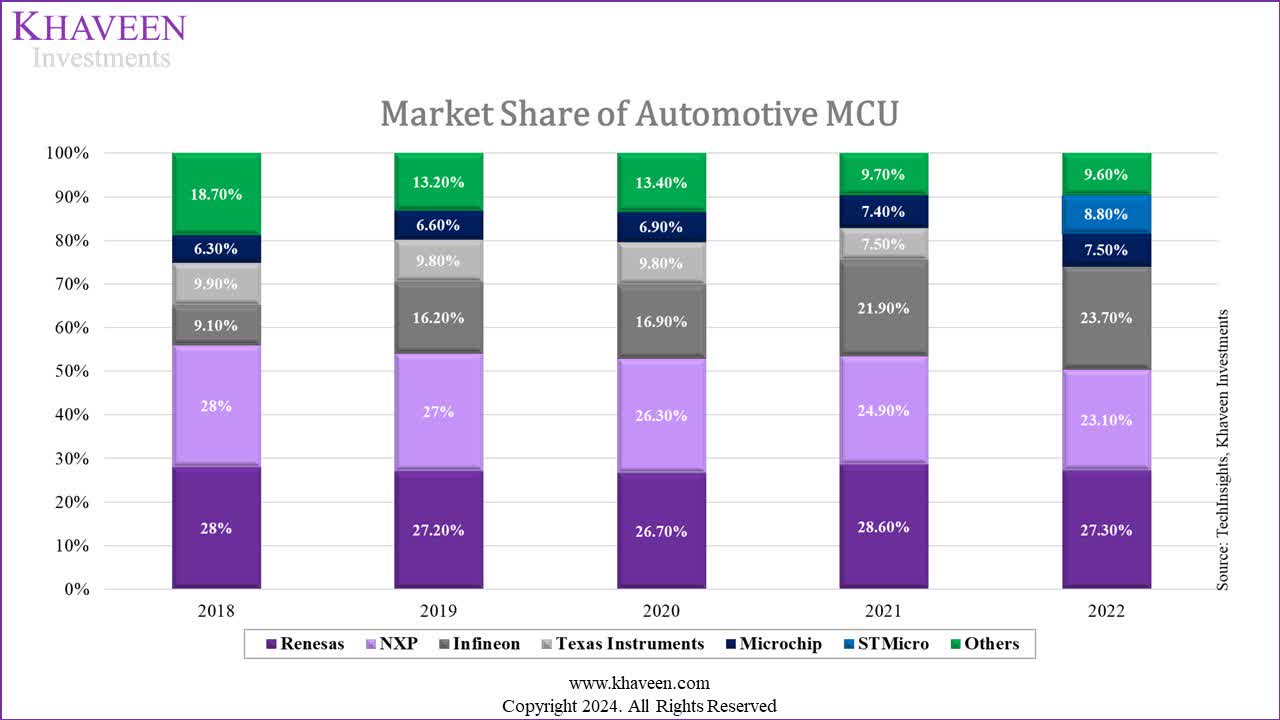
Based on the chart above, STMicro is 4th in the automotive MCU market with a share of only 8.8% in 2022, which contrasts with its market leadership of the overall MCU market (17.3% share). That said, the company’s share had improved as it was outside the top 5 automotive MCU companies before 2022. In 2018, its market share must have been below 6.3% (5th place Microchip). This indicates that STMicro has gained market share in automotive MCUs.
Other players such as TI had underperformed the automotive MCU market as its share had declined from 9.9% in 2018 to 7.5% in 2021 and had dropped below that beyond 2022 as it was outside the top 5. Moreover, competitors such as Renesas and NXP lost market share over the period with NXP being the worst impacted as its share fell by 5%. The best performer had been Infineon (OTCQX:IFNNY), which overtook the lead in the market with explosive share growth through 2022 as it acquired Cypress Semiconductor. Furthermore, Microchip also saw its share rise over the period by 1.2%. Overall, this indicates the automotive MCU market becoming more concentrated with the top 5 companies gaining more share over the period.
We updated our performance and product breadth comparison of the automotive MCU market from our previous analysis below.
|
Automotive MCUs |
Max Frequency Performance (MHz) |
Bit Size |
Max RAM (MB) |
Number of Products |
|
Texas Instruments (AM2634CPDFHMZCZRQ1) |
400 |
32 |
2 |
190 |
|
Renesas (RH 850) |
400 |
32 |
5 |
23 |
|
NXP (i.MX RT1170) |
400 |
32 |
2 |
35 |
|
Infineon (AURIX 32-bit TriCore) |
350 |
32 |
8 |
366 |
|
Microchip (PIC32MZ EF, SAM V7x) |
300 |
32 |
1 |
221 |
|
STMicro (SPC5) |
200 |
32 |
1 |
248 |
|
Average |
342 |
32 |
3 |
181 |
Source: Company Data, Digikey, Khaveen Investments
As seen in the table, Infineon continues to retain its lead with the highest number of automotive MCUs despite its slight performance disadvantage relative to other competitors with a lower frequency performance, which we believe supports its competitiveness and its rising market share. In relation to this, we believe STMicro’s product breadth, which is the second highest, also indicates its strong competitiveness as its market share has risen despite its product performance disadvantage with lower maximum frequency and memory capacity. In 2022, STMicro introduced several new automotive MCUs under its Stellar product family to support electrification and connectivity features. From its earnings briefing, management highlighted it had secured new design wins for its Stellar automotive MCUs which highlights the growing adoption of the Stellar portfolio.
Furthermore, while Microchip’s product breadth is smaller than Infineon and STMicro, it is still larger compared to Texas Instruments, NXP, and Renesas, which we believe could be a factor for its minor market share gains. On the other hand, companies with low product breadths such as TI, Renesas and NXP lost market share. Thus, we believe this highlights product breadth as a key competitive factor in the automotive MCU market.
Conclusion
Therefore, we believe STMicro’s market leadership in the overall MCU market is not primarily attributed to its position in the automotive MCU market, which is the largest end market of the MCU market, as STMicro has a relatively small share of 8.8% in 2022, placing it 4th place behind larger players. Notwithstanding, STMico’s market share in the automotive MCU market has risen slightly as it has broken into the top 5 companies, which we believe is supported by its product breadth strength, which is the second best only behind market leader Infineon.
Greater Focus on Non-Automotive MCUs
We compiled the non-automotive MCU revenue as the remainder of its overall MCU revenue and automotive MCU revenue and calculated their market share below.
Omdia, TechInsights, Khaveen Investments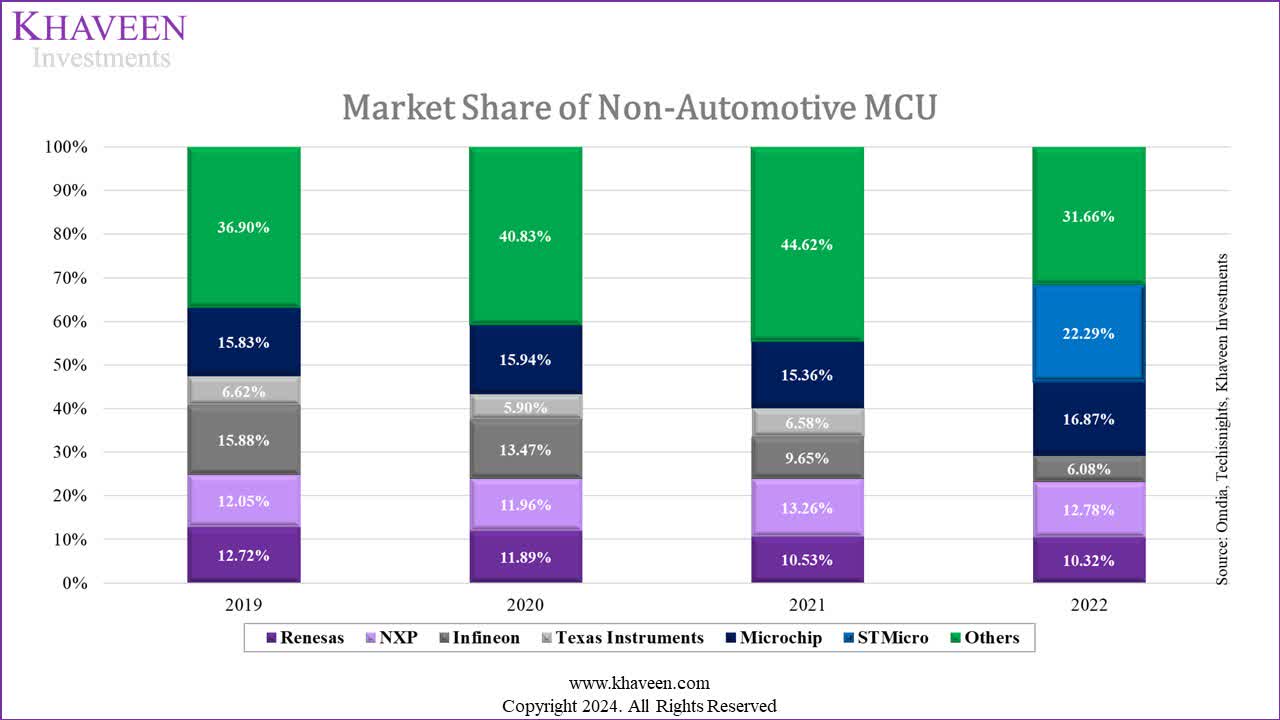
The chart above shows the non-automotive MCU market share. We calculated STMicro’s market share at 22.29% in 2022, indicating it is the market leader in non-automotive MCUs. However, in the prior years, due to a lack of data for STMicro’s automotive market share, we were unable to calculate its market share in non-auto MCU exactly and included it under Others. Though, from the first point, we highlighted STMicro’s rapidly rising share in the overall MCU market. While its automotive MCU market share has risen, it has a relatively low share of the market (8.8%), thus we believe its non-automotive MCU market share has likely risen.
On the other hand, as the market share of Others in the overall MCU had been stable while the share of Others in the automotive MCU declined, we believe the share of Others in the non-automotive likely rose strongly. Overall, we believe this indicates the non-automotive MCU market becoming more fragmented.
Furthermore, Microchip was the only company besides NXP that gained market share over the period while Renesas and Infineon’s shares faltered. We believe Infineon shifted its focus from non-automotive MCUs to automotive MCUs but its decline in non-automotive was still more than an increase in automotive as its overall market share has decreased as seen in the first point.
|
Overall MCUs |
Max Frequency Performance (MHz) |
Bit Size |
Max RAM (mb) |
Total non-automotive MCUs |
|
Texas Instruments (Arm-based MCUs) |
800 |
64 |
5 |
5,424 |
|
Renesas (RX Portfolio) |
240 |
32 |
2.56 |
19,470 |
|
NXP (ARM Cortex-M MCUs Powerhouse Portfolio) |
528 |
32 |
5 |
9,182 |
|
Infineon (AURIX 32-bit) |
300 |
32 |
2.5 |
6,940 |
|
Microchip (PIC32MZ EF) |
300 |
32 |
0.64 |
24,764 |
|
STMicro (STM32U5G7VJT6Q) |
600 |
32 |
3 |
5,370 |
|
Average |
461 |
37 |
3 |
11,858 |
Source: Company Data, Digikey, Khaveen Investments
Comparing the product breadth and performance of its non-automotive MCUs, Microchip has the largest portfolio breadth which we believe supported its share gains. While TI’s product breadth is lower compared to competitors and below average, it still remained resilient and gained some share, which we believe may be due to its performance advantage as its frequency performance is the highest among competitors. On the other hand, STMicro does not have a product breadth advantage as its number of non-automotive MCUs is lower than all competitors and does not have a clear performance advantage with all metrics below average except for frequency performance.
STMicro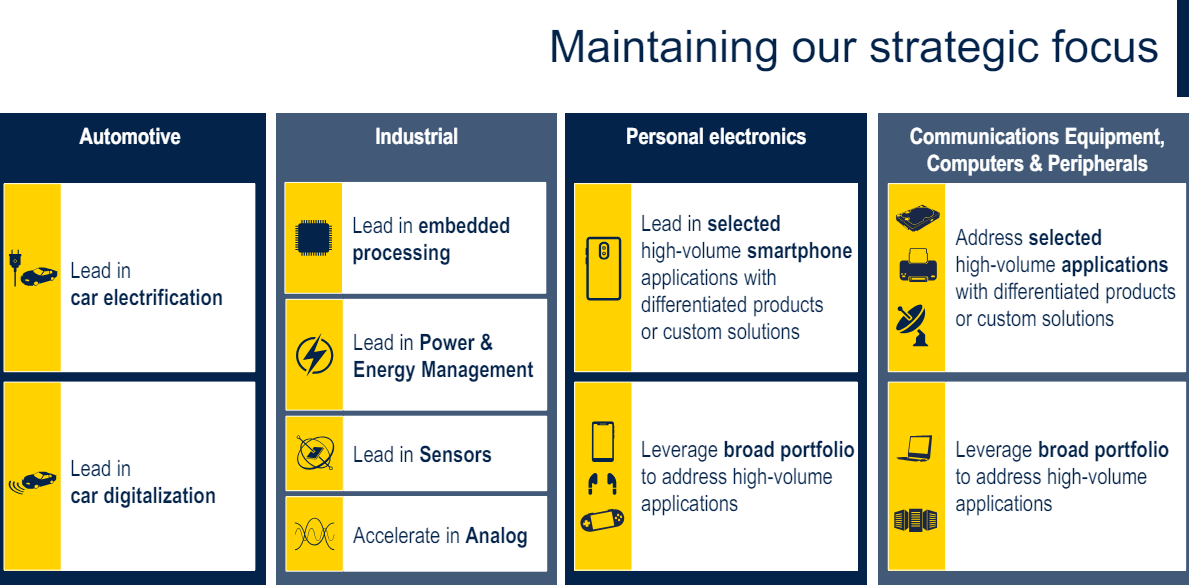
Based on the company’s investor presentation, the company highlighted that it leads in embedded processing which includes MCUs for the Industrial segment.
STMicro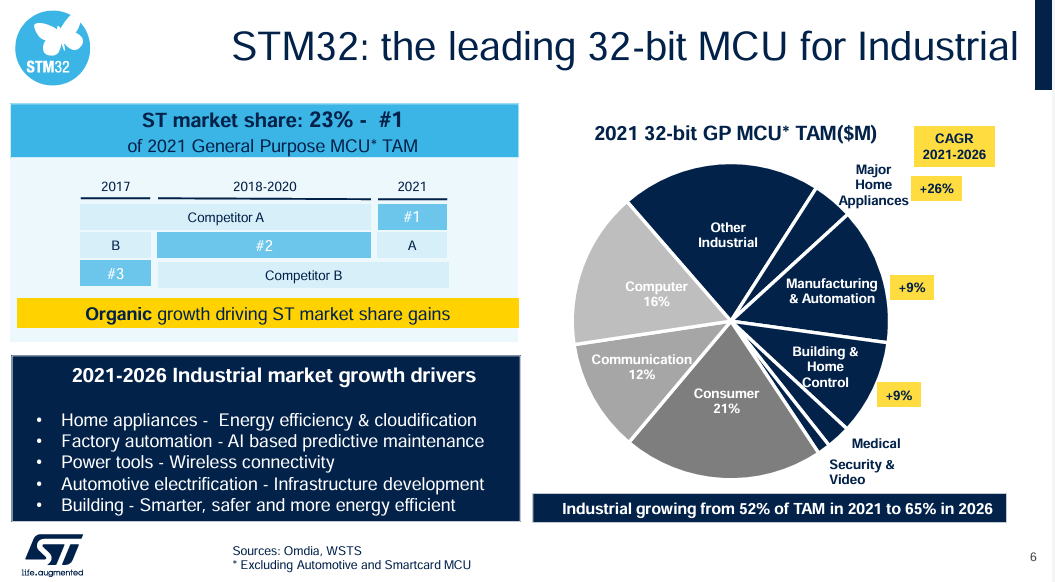
Furthermore, the company stated that its TAM breakdown in 2021 for Industrial subsegments for its MCUs including home appliances, manufacturing & automation, building & home control, medical & security & video accounted for 52% of its total MCU TAM, indicating its focus on the industrial MCU segment, followed by consumer which accounted for 21% of its TAM. Based on the chart, the company highlighted its rising market share to 23%, the first position in general-purpose MCUs, we believe this could likely refer to its market share in non-automotive MCUs which we calculated to be 22.3%.
STMicro, Khaveen Investments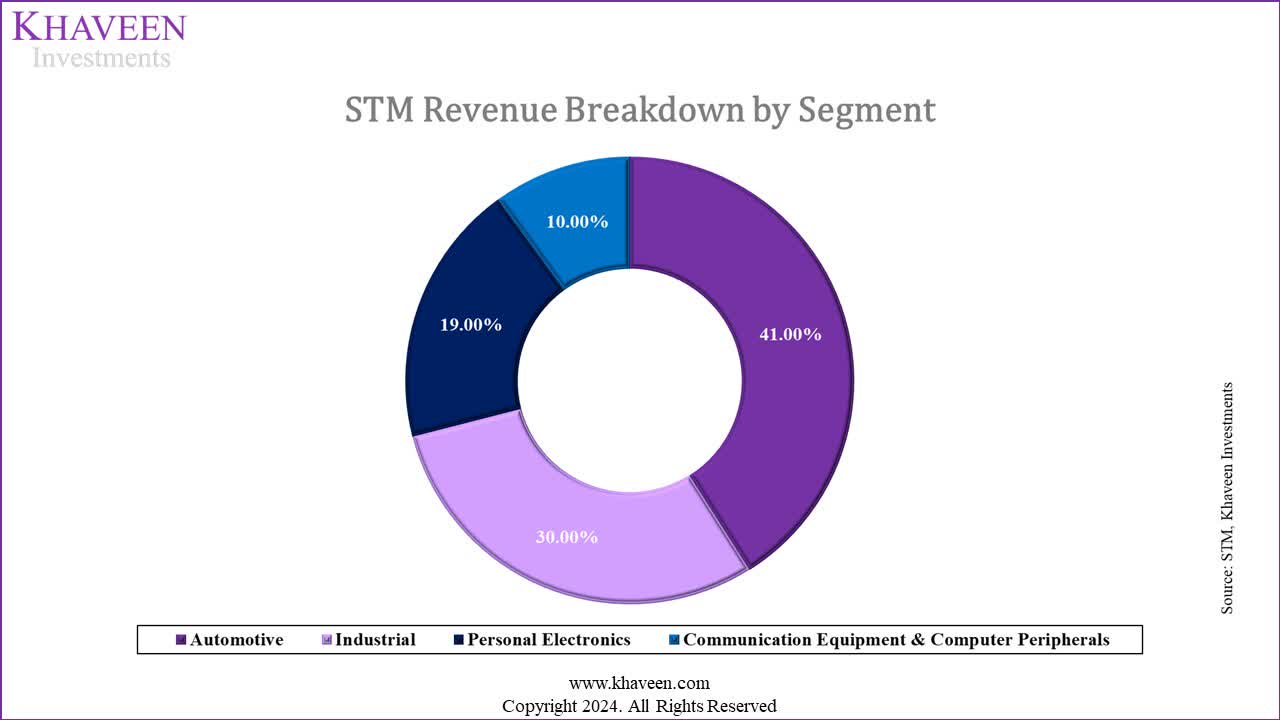
The company’s total revenue by end market breakdown shows Industrials as its second largest end market. Automotive accounted for 41% of its revenue. However, its ADG segment, which mainly includes products for its automotive segments, represented 45% of its total revenue. Thus, indicating the remaining segments such as MDG and AMS only contributed 4% of its automotive revenues.
|
STM Product Launches by End Market (MCU) |
Automotive |
Industrial |
Personal Electronics |
Communication Equipment & Computer Peripherals |
|
STM32H7R/S |
1 |
1 |
1 |
|
|
STM32MP2 |
1 |
|||
|
STM32WBA5 Product Line |
1 |
1 |
||
|
STSPIN32G4 |
1 |
1 |
||
|
STM32U5 |
1 |
1 |
||
|
STM32U0 |
1 |
1 |
||
|
Total |
1 |
5 |
4 |
2 |
Source: Company Data, Khaveen Investments
Finally, in terms of the company’s MCU product launches that we compiled so far in 2024, the majority of its products are catered to the Industrial segment followed by Personal Electronics and Communication Equipment & Computer Peripherals and lastly, Automotive, indicating STMicro’s focus on Industrials for MCUs. Based on its recent Q1 2024 earnings briefing, management stated that it has “introduced a new all-in-one tool for MEMS sensor evaluation and development, connected closely with the STM32 microcontroller ecosystem”, which highlights its product integration across its DAO portfolio that could support its product development capabilities.
Outlook
Overall, besides its strengthening position in the automotive MCU market, we believe STMicro’s rise in the overall MCU market is also buoyed by its leading position in the non-automotive MCU market. Specifically, we identified the company’s focus on Industrial MCUs as its advantage based on the company’s TAM focus (52%) on Industrial segments as well as its recent MCU product launches focusing mostly on the Industrial segment, thus we believe could be the factor for the company’s competitiveness in the overall non-automotive MCU market.
Risk: Growth Weakness in 2024
While we believe STMicro’s competitiveness in the MCU market is underpinned by its strength with rising automotive market share and product developments targeting the industrial market based on our analysis, we highlight the near-term growth headwinds the company faces in 2024 amid market weaknesses. For the full year, management guided revenues to decline by 16% at the midpoint, citing “accelerated inventory correction in Industrial, as well as a deceleration phase starting in Automotive”. Notwithstanding, we maintained our view of the industrial and automotive end markets to recover gradually in the second half of the year into next year as discussed in our previous analysis of ADI, thus we expect STMicro to capitalize with a potential recovery in 2025.
Verdict
Khaveen Investments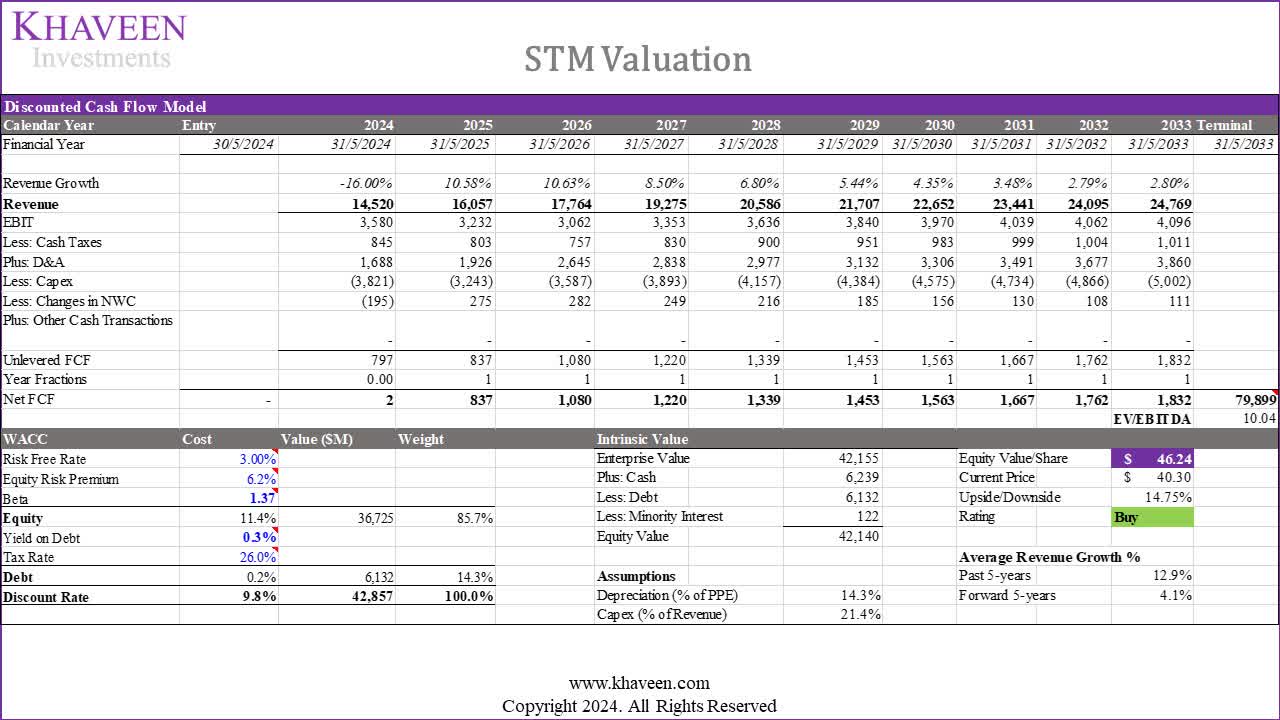
We updated our valuation from our previous analysis with our revenue projections updated in 2024 based on management guidance at a midpoint decline of 16% amid automotive and industrial market weaknesses. Beyond 2024, we updated our projections based on its segment breakdown for its MDG segment based on the MCU market CAGR of 7.6% and the 10-year average for ADG and AMS segments for a 5-year average of 9.4%. With a discount rate of 9.8% (company’s WACC), our model shows a 14.75% upside with its terminal value based on its 10-year average EV/EBITDA (10.04x).
All in all, we believe market leader STMicro is well positioned to benefit from the growing MCU market with a forecasted market CAGR of 7.6% driven by increased MCU adoption across various sectors such as automotive, industrial, smartcard security, and consumer applications. We believe its overall MCU market outperformance and rising market share indicate a competitive edge, particularly in the non-automotive segment. Despite holding a smaller share in the automotive MCU market, we highlighted that STMicro has made strides to break into the top five largest companies, supported by a strong product lineup. Furthermore, we believe its focus on industrial MCUs, evidenced by its TAM breakdown and recent product launches could enhance its competitiveness in the non-automotive MCU market. Despite near-term growth weaknesses, we expect the company’s revenues to recover beyond 2024 supported by the analyzed strengths in MCUs. Thus, we rate the company as a Buy with a lower price target of $46.24 compared to $65.15 in our last coverage, reflecting a lower 5-year forward average growth (4.1% vs 10.9%), though it still represents a 14.75% upside due to a -21% decline in its share price since our previous analysis.