With concerns about interest rates and unemployment now is a great time to reduce exposure to the financial sector. D. Anschutz/DigitalVision via Getty Images
The purpose of this series is to review the real investment portfolios of my retirees John and Jane to gain perspective on how their portfolio is performing (month-to-month) while also discussing the process behind why we are making certain changes to their portfolio. I started this series to give readers an opportunity to better understand how John and Jane’s portfolios are evolving over time and I include historical results that show where the portfolio has been while also incorporating a dive into investments we are looking to add/trim/eliminate from the portfolio. It is important to note that the investments of interest to add/trim/eliminate can apply to all three of the portfolios that fall under this series.
Closing John’s Position In Bank OZK
Following the theme of the previous month’s article, we made the decision to dispose of the remaining position in Bank OZK (OZK) as we trim back exposure to the banking industry. The negative sentiment towards OZK truly began in June 2018 and was entirely focused on concerns about the performance of the real estate specialties group (RESG) portfolio after a few troubled loans defaulted. My last coverage of OZK was Bank OZK: A Sober Review Shows The Concerns Are Priced In goes back to December 2018 when I rated the stock as a buy after the share price was slashed by 53% from the start of 2018 to the end.
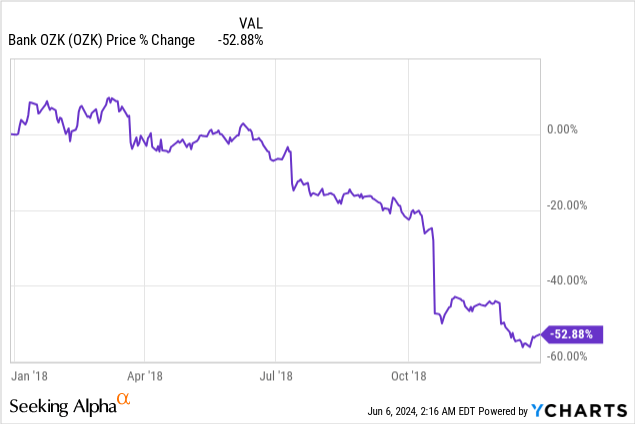
The RESG portfolio concerns at the time were related to two loans that had been on the books for at least a decade and were originated prior to the financial crisis in the late 2000’s. The bulk of the RESG portfolio at the time was originated in 2015 or after so to attribute the performance of loans that were no longer characteristic of the bulk of the portfolio opened the door to what I considered to be a great buying opportunity.
Why This Time Could Be Different
OZK has built a name for itself with its RESG portfolio and has funded massive projects across the United States and this is where the problem starts. OZK’s exposure to South Florida represents the largest concentration of commercial real estate in OZK’s portfolio. The truth is we are seeing lots of cracks in the Florida market especially in places like Miami where inventory in the housing market has grown tremendously.
Secondly, we have the size of the RESG portfolio relative to the size of the institution. Wells Fargo pointed out in its downgrade that “Bank OZK’s concentration in the construction lending sector is unmatched, being the third-largest construction lender while only ranking as the 51st-largest bank based on assets.” JP Morgan has considered this topic to be important enough that it even released in the article Are banks vulnerable to a crisis in commercial real estate? in April 2023 to discuss the risk associated with CRE and the direction of where things are going.
Since March, when the abrupt and unexpected failure of two regional U.S. banks, Silicon Valley Bank and Signature Bank, rocked U.S. markets, investors have begun voicing concerns about the balance sheet vulnerabilities of regional banks—and more specifically, their exposure to commercial real estate (CRE).
Those concerns have some merit. Compared to big banks, small banks hold 4.4 times more exposure to U.S. CRE loans than their larger peers. Within that cohort of small banks, CRE loans make up 28.7% of assets, compared with only 6.5% at big banks.1 More worrying, a significant percentage of those loans will require refinancing in the coming years, exacerbating difficulties for borrowers in a rising rate environment.
Now factor in rising rates and the challenge of extending capital to help extend the life of the loan and we begin to paint a picture where limited flexibility and stressed valuations could result in a number of issues that don’t represent a positive outcome.
The following image from the same JP Morgan article doesn’t include OZK but gives an interesting perspective to the exposure to CRE as it relates to CET1 capital.
CRE Exposure As Percentage Of CET1 Capital (JP Morgan Private Bank)
With these factors in mind, this is not the same “crisis” that hit OZK back in 2018 because the portfolio is fundamentally different.
This is why we executed the sale of remaining shares even though OZK has been a long term hold that we have added to and trimmed back over the last six years.
OZK – 2024-5 Trade (Charles Schwab)
If we are being balanced in our assessment of the situation, I expect that OZK will emerge from the situation fine with losses that are within guidance/expectations. The key factor that needs to be considered is that our analysis and decision is entirely based on the potential for upside/downside and the risk of acting/not acting. From this perspective I am saying that there is currently too much opportunity for the risk of downside as compared to the benefit of upside.
So for those who want to stay bullish on OZK I would make the argument that the likelihood of further downside far outweighs the likelihood of upside when it comes to the valuation of the stock. Additionally, if we are proven wrong and OZK swings to the upside there isn’t a significant loss by having acted and sold shares when we did.
As a final note, we aren’t out on OZK altogether, in fact, we have increased the exposure of preferred shares with the recent pullback in price. Bank OZK Preferred Series A (OZKAP) is attractively priced at current levels and the potential for upside is looking much stronger/outweighs the risk/likelihood of further downside. The current yield of 7.33% on OZKAP looks much more appealing than the current yield of 4.02% on OZK common shares.
Now let’s look at the results of John’s portfolio during the month of April 2024 2024.
April Dividend Increases
John had a total of seven companies companies that paid increased or special dividends during the month of April.
- EPR Properties (EPR) – Dividend increased by 3.6%.
- Essex Property Trust (ESS) – Dividend increased by 6.1%.
- Realty Income (O) – Dividend increased by .2%.
- Occidential Petroleum (OXY) – Dividend increased by 22.2%.
- Bank OZK – Dividend increased by 2.6%.
- Sun Communities (SUI) – Dividend increased by 1.1%.
- WP Carey (WPC) – Dividend increased by .6%.
Both ESS and OZK have been eliminated from the portfolio but the increased dividend was collected during the month of April.
Traditional IRA – April Trades
There were a total of two trades during the month of April.
Traditional IRA – 2024-4 – Trades (Charles Schwab)
We used the pullback in price on CCI and OZKAP to add more layers at a lower cost basis. Both of these trades would be examples of the most difficult part of a strategy of buying low and selling off higher cost-basis shares so that we end with a solid position at a much lower cost basis.
Roth IRA – April Trades
There were a total of two trades during the month of April.
Roth IRA – 2024-4 – Trades (Charles Schwab)
Nuveen NASDAQ 100 Dynamic Overwrite Fund (QQQX) saw a brief pullback in price during the month of April while Apple Hospitality (APLE) has pulled back even further.
APLE represents a great example of how we have been able to layer into a better position over time and reduced our exposure to what would have been a much higher cost basis position.
APLE – 2024-4 – Trade History (Charles Schwab)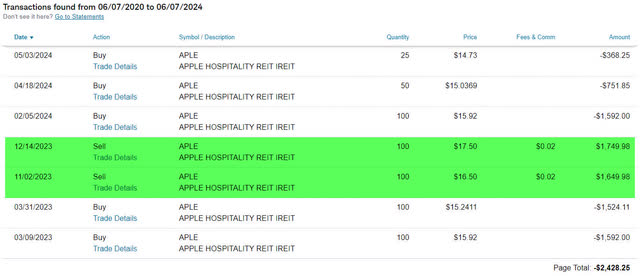
Over the last two years there have been a handful of buys and two sells on APLE. Looking at the image above, you could assume that we were able to sell shares of APLE at a pretty modest gain relative to today’s current price of $14.40/share. But what I want to point out is that both of these positions were actually sold at a slight loss due to the high cost basis that was established prior to 2020.
APLE – 2024-4 – Realized Loss.jpg (Charles Schwab)
A review of these trades from a realized gain/loss perspective shows that a loss was taken on both trades. So why is this a positive?
The way I look at this is that we were able to reduce John’s exposure to a higher cost basis and replace those shares with ones that are at a considerable discount which means John is now getting more “bang for the buck” from the dollars he has invested in APLE. If we use the highest cost shares that were sold ($17.50) and continued to hold those shares instead of repurchase at the $15.92/share (purchased on 02/05/2024) it would have eaten up the next 20 months of dividends ($17.50/share – $15.92/share divided by the monthly dividend of $.08/share = 19.75 months of dividends eaten up).
Our continued move towards a more efficient cost basis maximizes the yield of the dollars invested and helps reduce the inefficiency that comes from utilizing a strict “buy-and-hold” strategy.
Portfolio Composition
The images below are focused on what is happening now and moving forward.
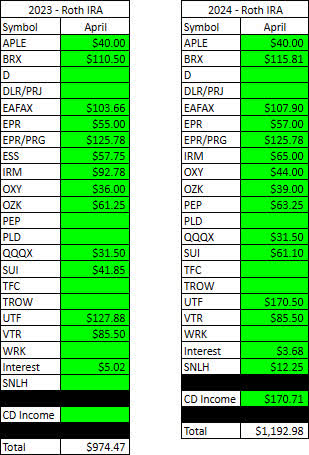
The first image shows what has happened year-over-year with the portfolio in terms of which holdings are generating income.
Traditional IRA – April – 2023 V 2024 Dividend Breakdown (CDI) Roth IRA – April – 2023 V 2024 Dividend Breakdown (CDI)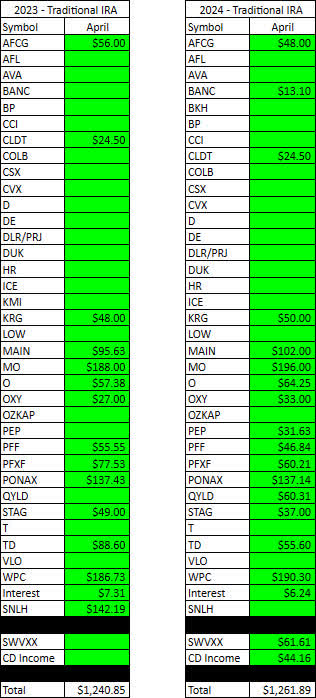
Here is an updated table of the extremely conservative forecast that suggests income will be down -3.9% (previously down -5.0%) in the Traditional IRA and down -4.2% (previously down -6.8%) in the Roth IRA for FY-2024. Remember, these numbers look bleak because it assumes that we see no dividend growth, and we do not assume consistent income levels from SWVXX or CD’s because we are trying to err on the side of safety.
The Roth IRA has produced significantly more income in the month of April as compared to the near breakeven year-over-year numbers for the Traditional IRA.
Retirement Projections – April 2024 (CDI)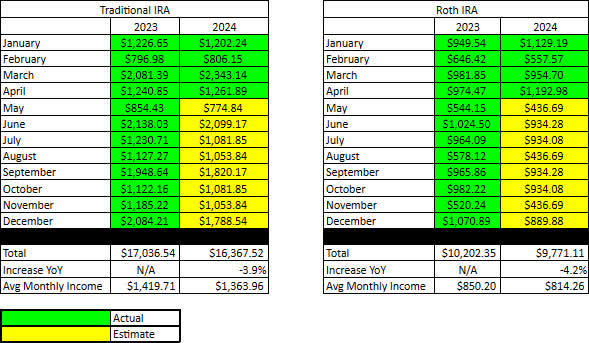
The next two images have been updated from my forecasting articles to look at how much the income has grown on a monthly basis and separates out what income is from dividends and what comes from CDs/Money Markets, etc.
This offers more insight/context as to where John’s income is being derived (equities, fixed income, etc.). These are also more realistic numbers of what we expect to see for income growth and also gives us the ability to better track which months have the largest impact.
Here is a basic understanding of what each of the columns/fields mean:
- 2023 – Income results for 2023
- 2024 (Ex CDs) – Estimated income 2024 (yellow) and actual income 2024 (green) but excludes all income earned from money markets, CD’s, etc.
- 2024 (W CDs) – Estimated CD & money market income 2024 (yellow) and actual income 2024 (green). Separated because we want to differentiate between dividend income and growth compared to CD’s/money market that are not subject to increases.
- Total Income – Combined total income from dividends, CDs, Money market, etc.
- 3%/5%/7% Increase – These columns serve as a marker so you can see how much income would need to be hit that month to achieve a specific increase. I will likely change these numbers to be more account specific in the future (some accounts are growing more rapidly than others).
2024-4 – Traditional IRA Income & Forecast Comparison (CDI) 2024-4 – Roth IRA Income & Forecast Comparison (CDI)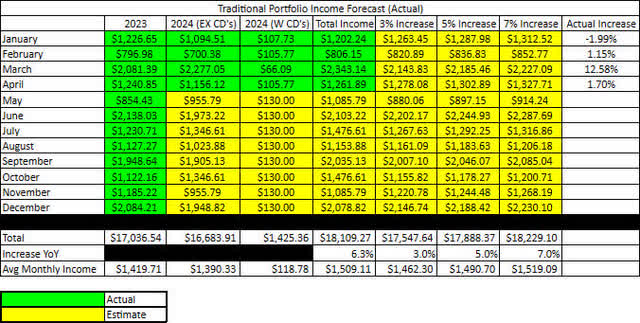
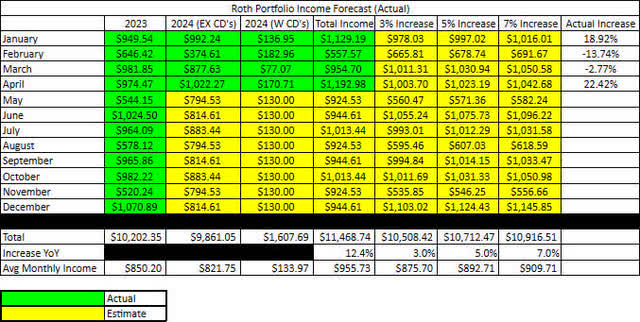
From the numbers above, we are expecting to see a realistic income growth of 6.3% in the Traditional IRA and 12.4% in the Roth IRA FY-2024. This down from from 7.6% (this is primarily due to timing changes of when dividends were received) from March’s article in the Traditional IRA and up from 10.7% in the Roth IRA March article.
From this you can see that we expect to see the Roth IRA income grow at a much faster pace than the Traditional IRA and that the Traditional IRA will nearly achieve high end income growth of 7% but the Roth IRA is nearly able to double that level of growth.
Lastly, this table is intended to show how much
Conclusion
Reducing John and Jane’s exposure to financial stocks has been a regular discussion point in recent articles and while OZK wasn’t the highest concern that we had it definitely made sense to reduce exposure at this time. At this point, I would say that a share price less than $35 might be a reasonable re-entry point but we simply don’t know how much momentum the negative news will create. If anything, we may establish a small position at $35/share with the potential of really layering in a position under $30/share.
Looking at the image below over the last three years in particular the share price has rarely moved below $35/share. If we assume that everything at OZK is fundamentally sound would further supporting using this as an entry point.
OZK – 2024-5 Share Price (CDI)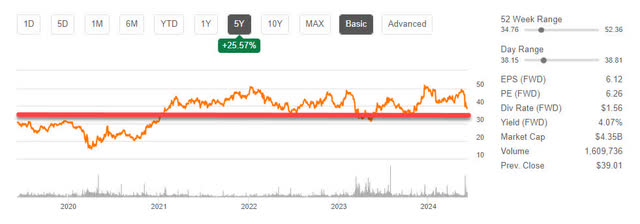
John’s retirement portfolios as a whole in the month of April saw strong income growth for the Roth IRA and barely above the same amount of income earned in the Traditional IRA. One of the major differences between John’s retirement account and his wife Jane’s retirement accounts is that John is actively taking withdrawals so the fact that his account balance remains high (relative to previous balances) even after he has drawn $27,318.51 (since January of 2022) indicates that his portfolio is doing exactly what we intended to do which is to provide consistently growing income with the goal of covering his required minimum distribution (RMD) for as long as reasonably possible with the goal of avoiding the need to sell shares to satisfy the RMD.
What stocks are you seeing that aren’t in John’s Retirement portfolio? Are there any compelling investments I should be looking at that? I would love to hear any ideas/suggestions in the comment section.
Thanks for your patience as I get caught up on these articles after recently having carpal tunnel surgery on my right hand. I am looking forward to providing some updates for the month of April by May 18th.
John and Jane are long all holdings mentioned in this article.


