Natallia Pershaj/iStock via Getty Images
Liquid Natural Gas, known as LNG, had a surge in 2022. This was due to Russia’s invasion of Ukraine, which caused European countries to change their buying patterns. LNG shipping prices increased accordingly.
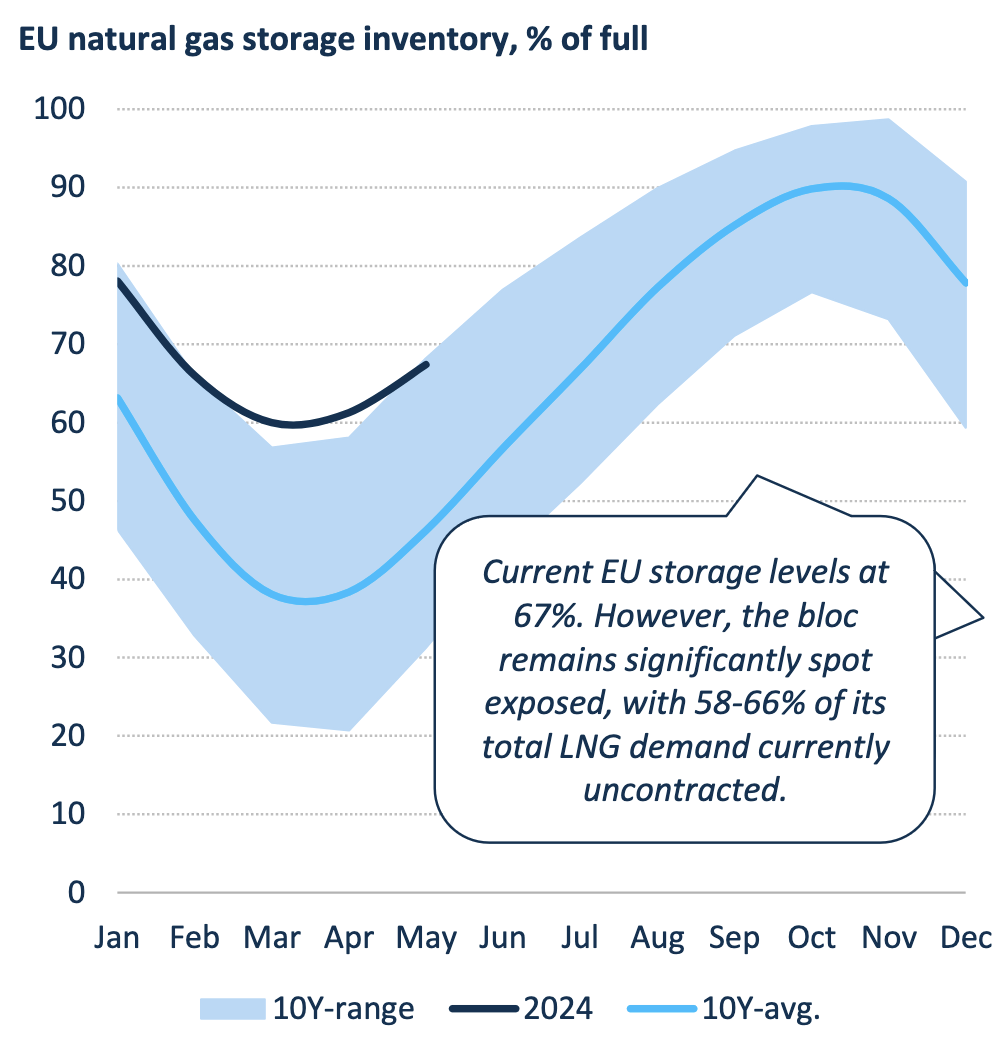
Europe remains the biggest importer of LNG, but it appears to be adopting more of a wait and see approach in 2024, with up to 66% of its LNG demand uncontracted:
Higher rates in 2022 allowed FLEX LNG Ltd. (NYSE:FLNG) to secure higher long-term charter rates for its vessels. They also gave management the wherewithal to raise dividends significantly.
Company Profile:
Flex LNG Ltd. is an LNG shipping company with a fleet of thirteen fuel efficient, fifth generation LNG carriers. Its fleet consists of 9 M-type, Electronically Controlled, Gas Injection (“MEGI”) LNG carriers, and 4 Generation X Dual Fuel (“X-DF”) LNG carriers built between 2018 and 2021. It also provides chartering and management services. Flex LNG Ltd. was incorporated in 2006 and is based in Hamilton, Bermuda. (FLNG site.)
Fleet:
FLNG’s fleet has 50 years of minimum charter backlog, which may grow to 69 years with charterer’s extension options. FLNG has 3 charters fixed into 2030-2033, 2 fixed into 2029, 4 into 2027, and 2 into 2026. The company’s shortest charter is for the Flex Constellation. In January 2024, the charterer of Flex Constellation sent notice that they will not utilize their extension option under the time charter.
However, Flex Constellation completed her 5-year special survey in April, and traded in a challenging spot market for a short period, before commencing a firm time charter of 312 days + 1-year charterer’s option.
The Flex Courageous vessels progressing according to schedule and budget. She is now currently out of drydock berthed alongside quay for finalization and expected to be back in service at end-May.
Hidden Dividend Stocks Plus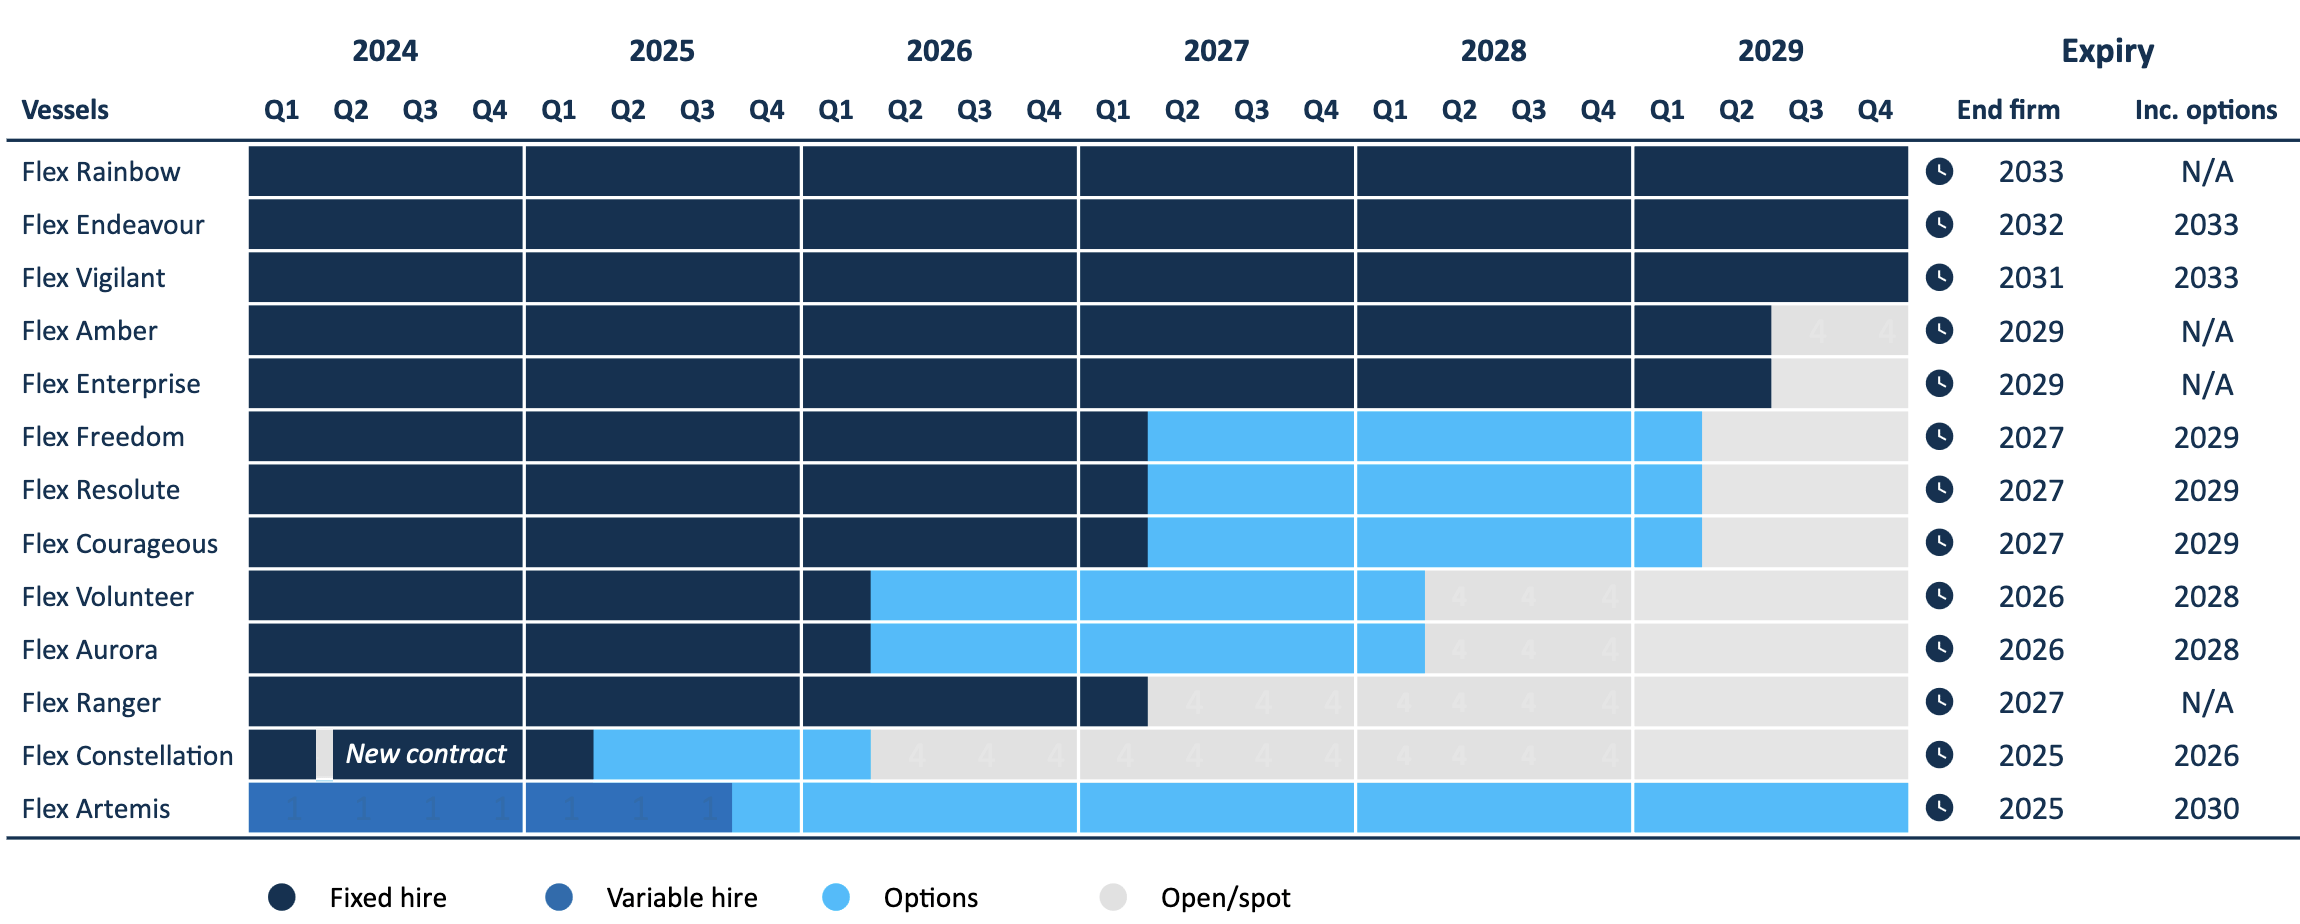
Industry Trends:
While Europe is still the top LNG importer, its 2024 usage is down 20%, which has been replaced by China, up 15%, and India, also up 15%, with other emerging nations also taking advantage of lower LNG prices.
The US, Australia, and Qatar are the top 3 LNG exporters, with the US and Australia’s volume both up 3%, and Qatar’s down slightly in 2024, as of April.
FLNG site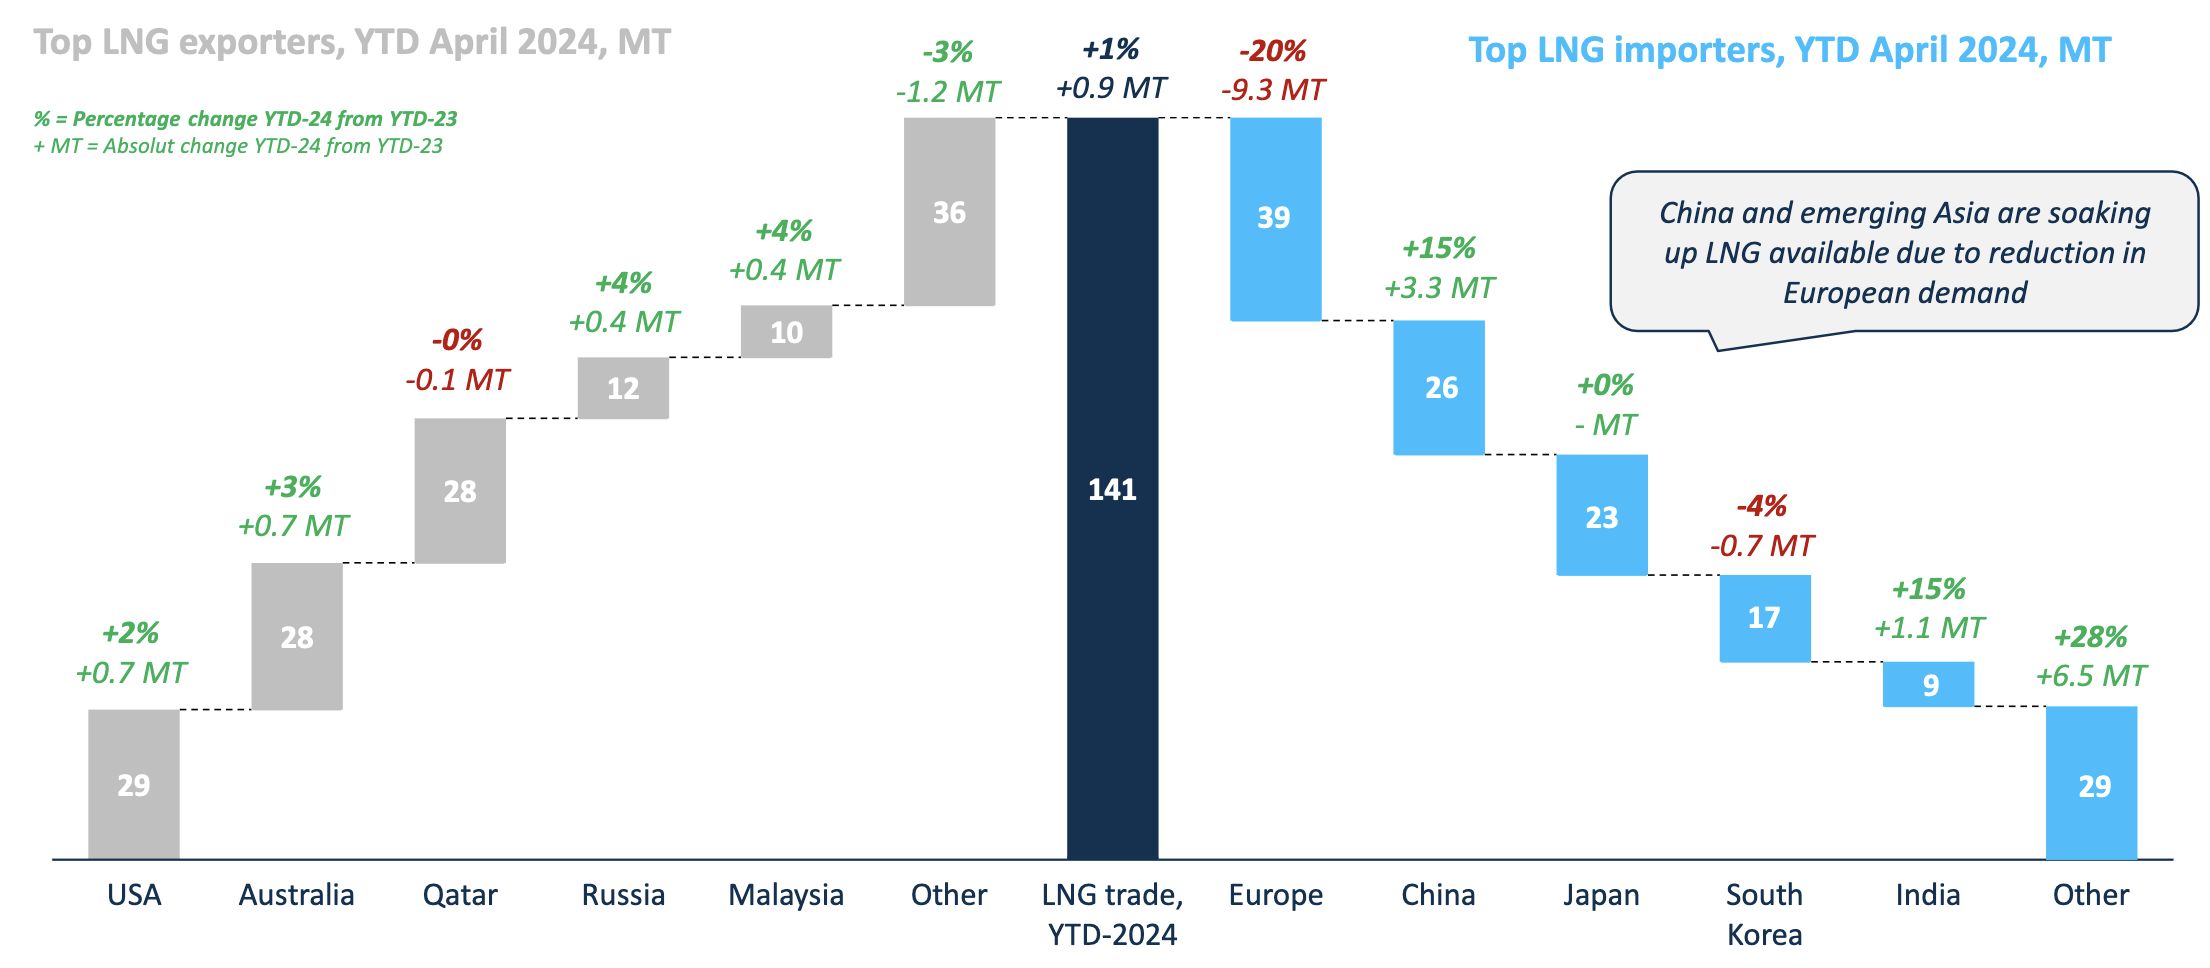
While there is a glut of newbuild vessels coming online in 2025–2027, but only 7% are uncommitted, which should help support shipping rates. FLNG is 100% booked in 2024, and 91% booked in 2025.
FLNG site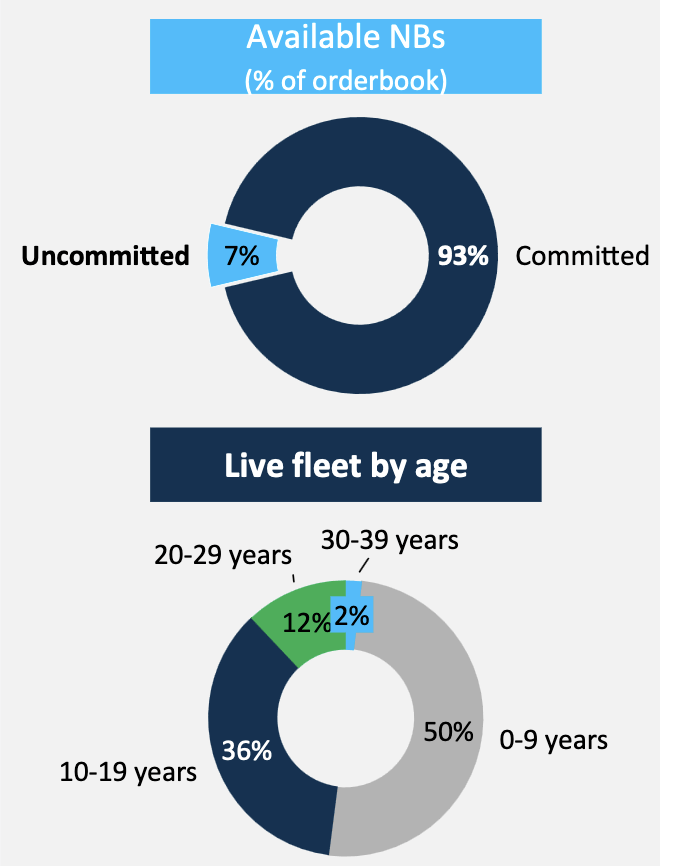
Countering the new supply of vessels is a 3rd wave of LNG production, which should start coming online in 2025:
FLNG site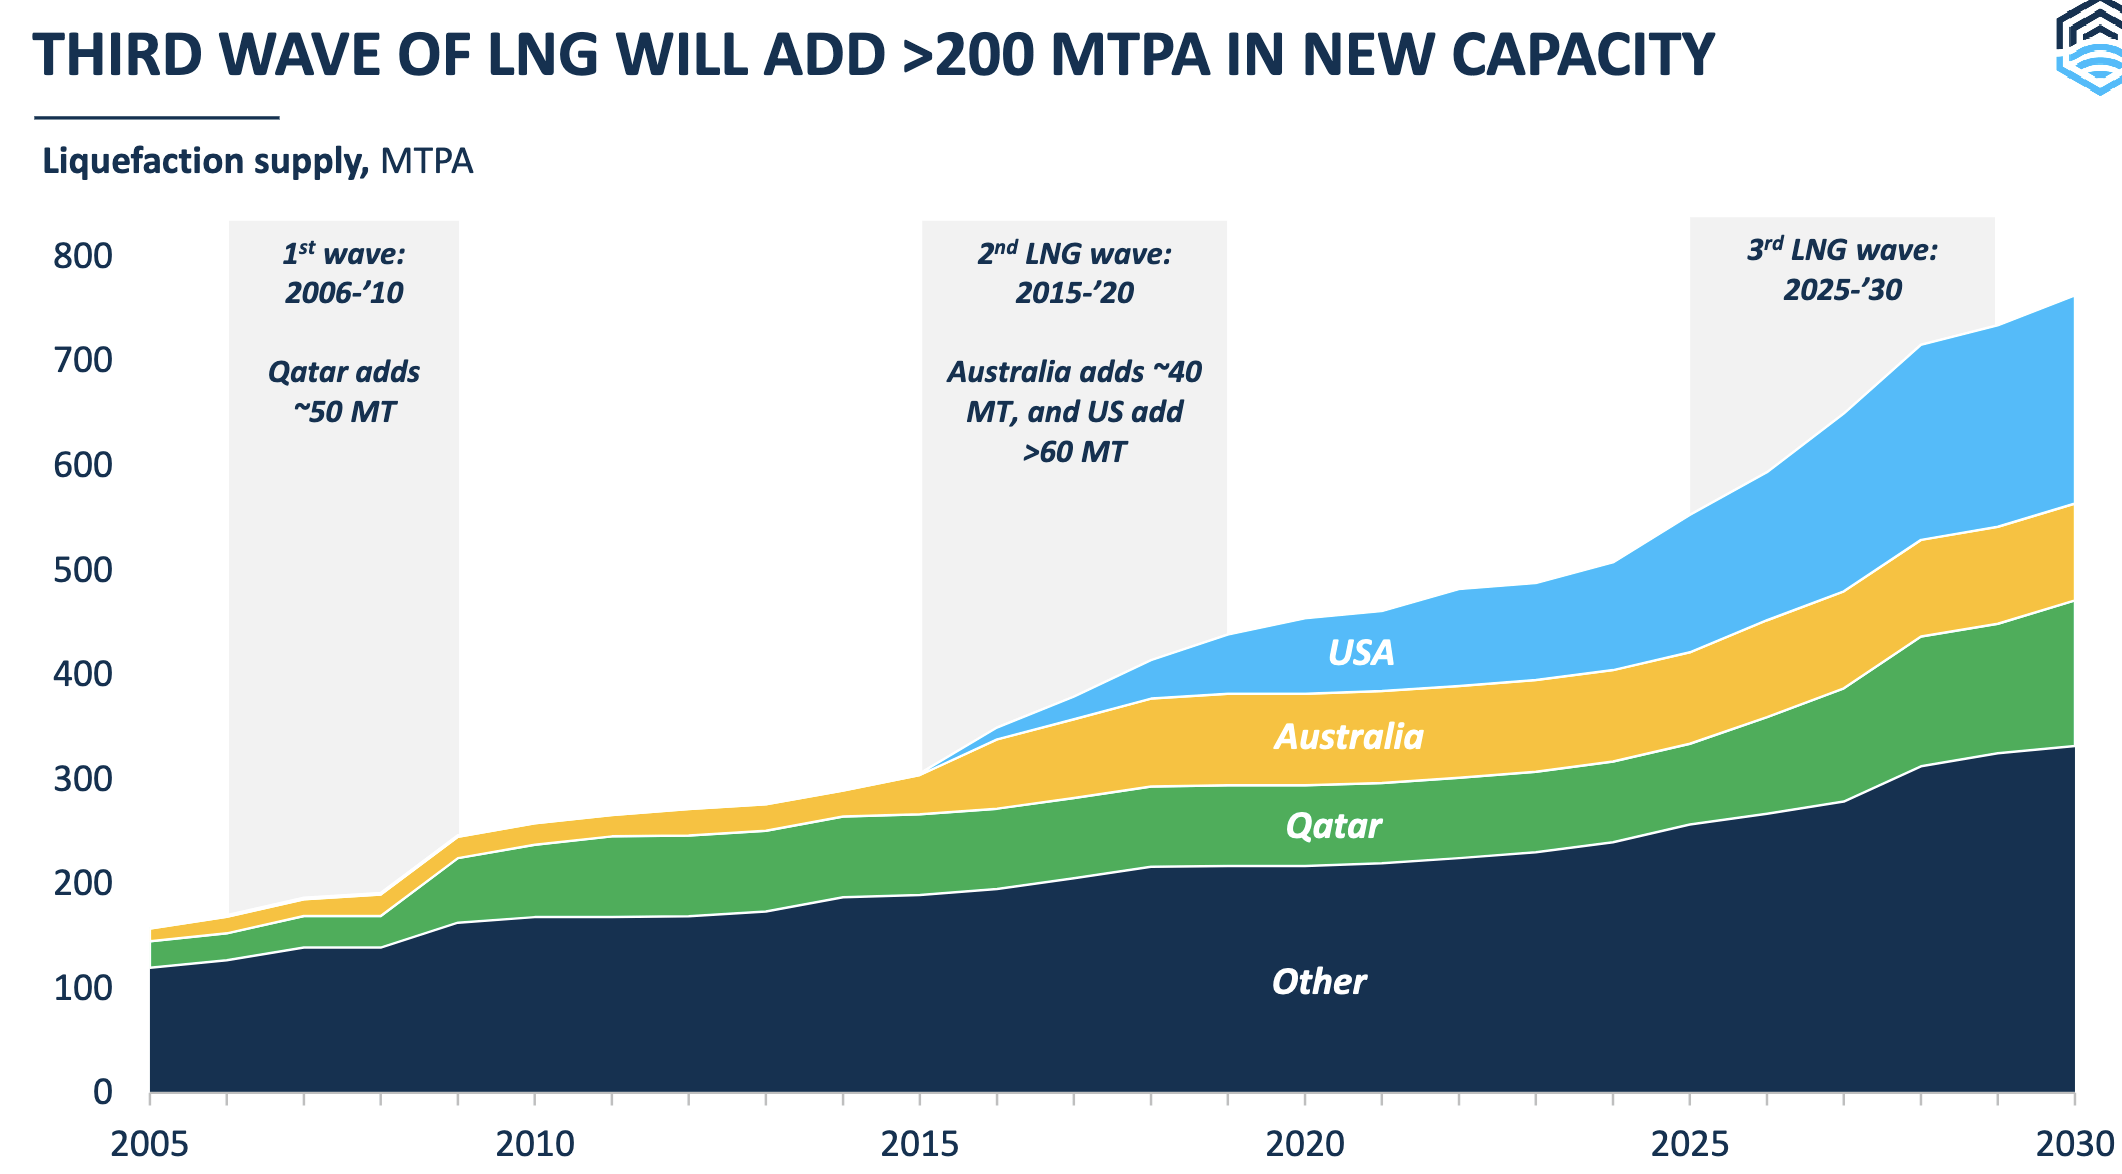
Earnings:
Q1 ’24: Revenue was lower, due to the drydocking operations. In addition, the average Time Charter Equivalent (“TCE”) rate was $76,539/day, vs. $81,114 per day for Q4 2023.
Net Income and Diluted EPS both jumped ~100%, due to a $7M gain on derivatives, vs. an $11M loss in Q1 ’23. Excluding that item, Adjusted EPS rose 7.7%, while Adjusted EBITDA was down 2.6%. Interest expense and the share count were both ~flat.
2023: Revenue was up 6.6%, but Net Income was down 36%, due to a $32M increase in Interest expense, and an $80M decrease in gains on derivatives. Adjusted net income for the year ended December 31, 2023, was $137.3 million and basic adjusted EPS of $2.56, compared to an adjusted net income of $150.7 million and basic adjusted EPS of $2.83 for the year ended December 31, 2022.
Hidden Dividend Stocks Plus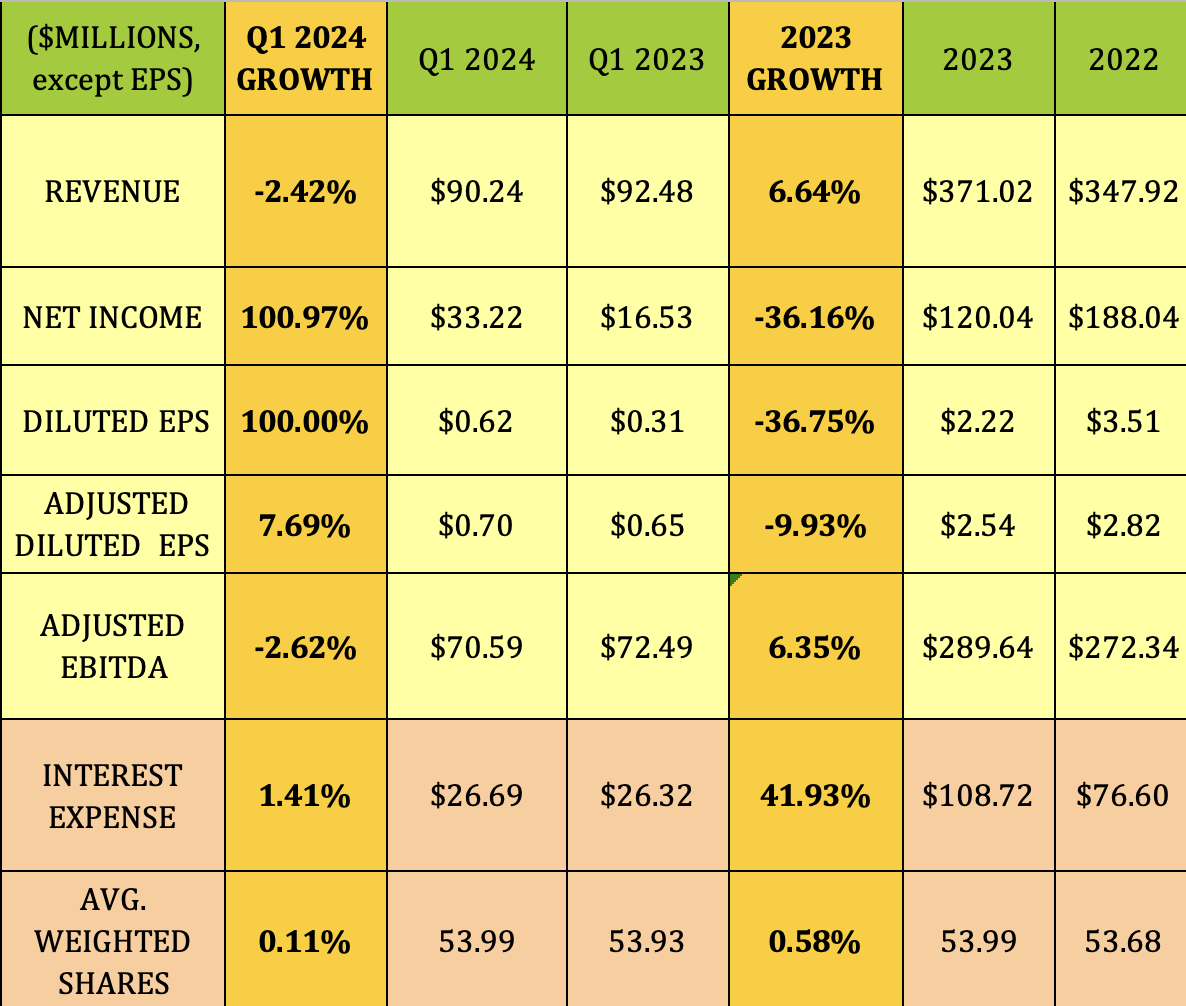
2024 Outlook:
“Q2 is the softest quarter due to the seasonality, so we do expect our Time Charter equivalent earnings to be reduced slightly in Q2, which has been the norm since we started this company.
We expect these average rates to be around $72,000 to $74,000, as we do have one ship on variable higher charter, and we also had Constellation exposed to the spot market for a short period of time in Q2. Thus, revenues with two ships out of drydocking and the spot market as mentioned, we expect revenues to be close to $85 million for Q2.”
“Typically in Q3, we will have all ships back in operation. That tend to be a better quarter impacting the ship we have on a variable higher, and usually Q4 is the strongest quarter as we are heading into the winter season, where demand is peaking.” (Q1 ’24 call.)
Dividends:
At its 7/11/24 price of $26.42, FLNG’s forward dividend yield is 11.36%, while its trailing dividend yield is 11.83%. It should go ex-dividend next on ~8/30/24, with a ~9/5/24 pay date.
Hidden Dividend Stocks Plus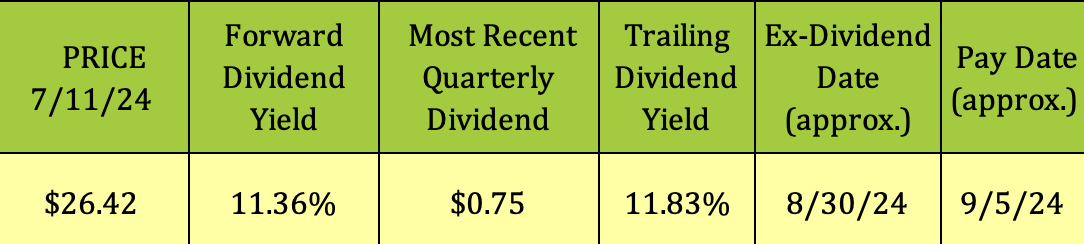
FLNG has a huge 5-year dividend growth rate of ~254%, due to the big ramp up in payouts in 2021 to $1.85, vs. just $.20 in 2020.
Management uses a combination of variables to determine dividend amounts, including earnings, cash flow, liquidity, debt maturities, and capex liabilities, among others.
On an Adjusted EPS basis, the Dividend Payout Ratio rose to 133% in 2023, vs. 129% in 2022, and improved to 107% in Q1 ’24, but was still over 100%.
Looking at coverage on an EBDA basis shows similar ratios of ~87-88% in 2022-2023, and an improved ratio of 72% in Q1 ’24.
Hidden Dividend Stocks Plus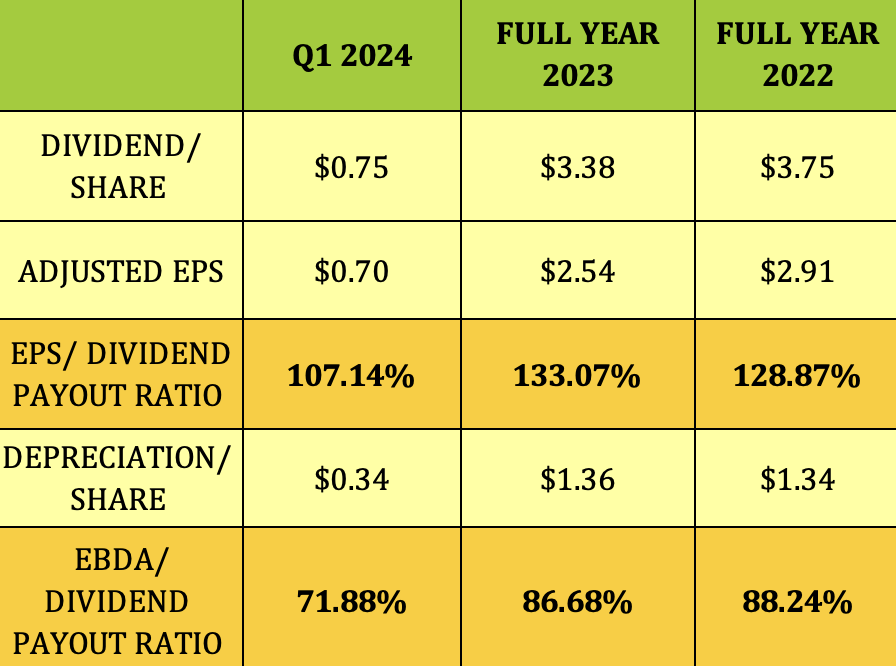
Cash flow from operations was $49M in Q1 ’24, vs. $40M in paid dividends, and -$40M in net working capital changes & debt payments, resulting in cash declining by $28M to $383M, as of 3/31/24.
FLNG site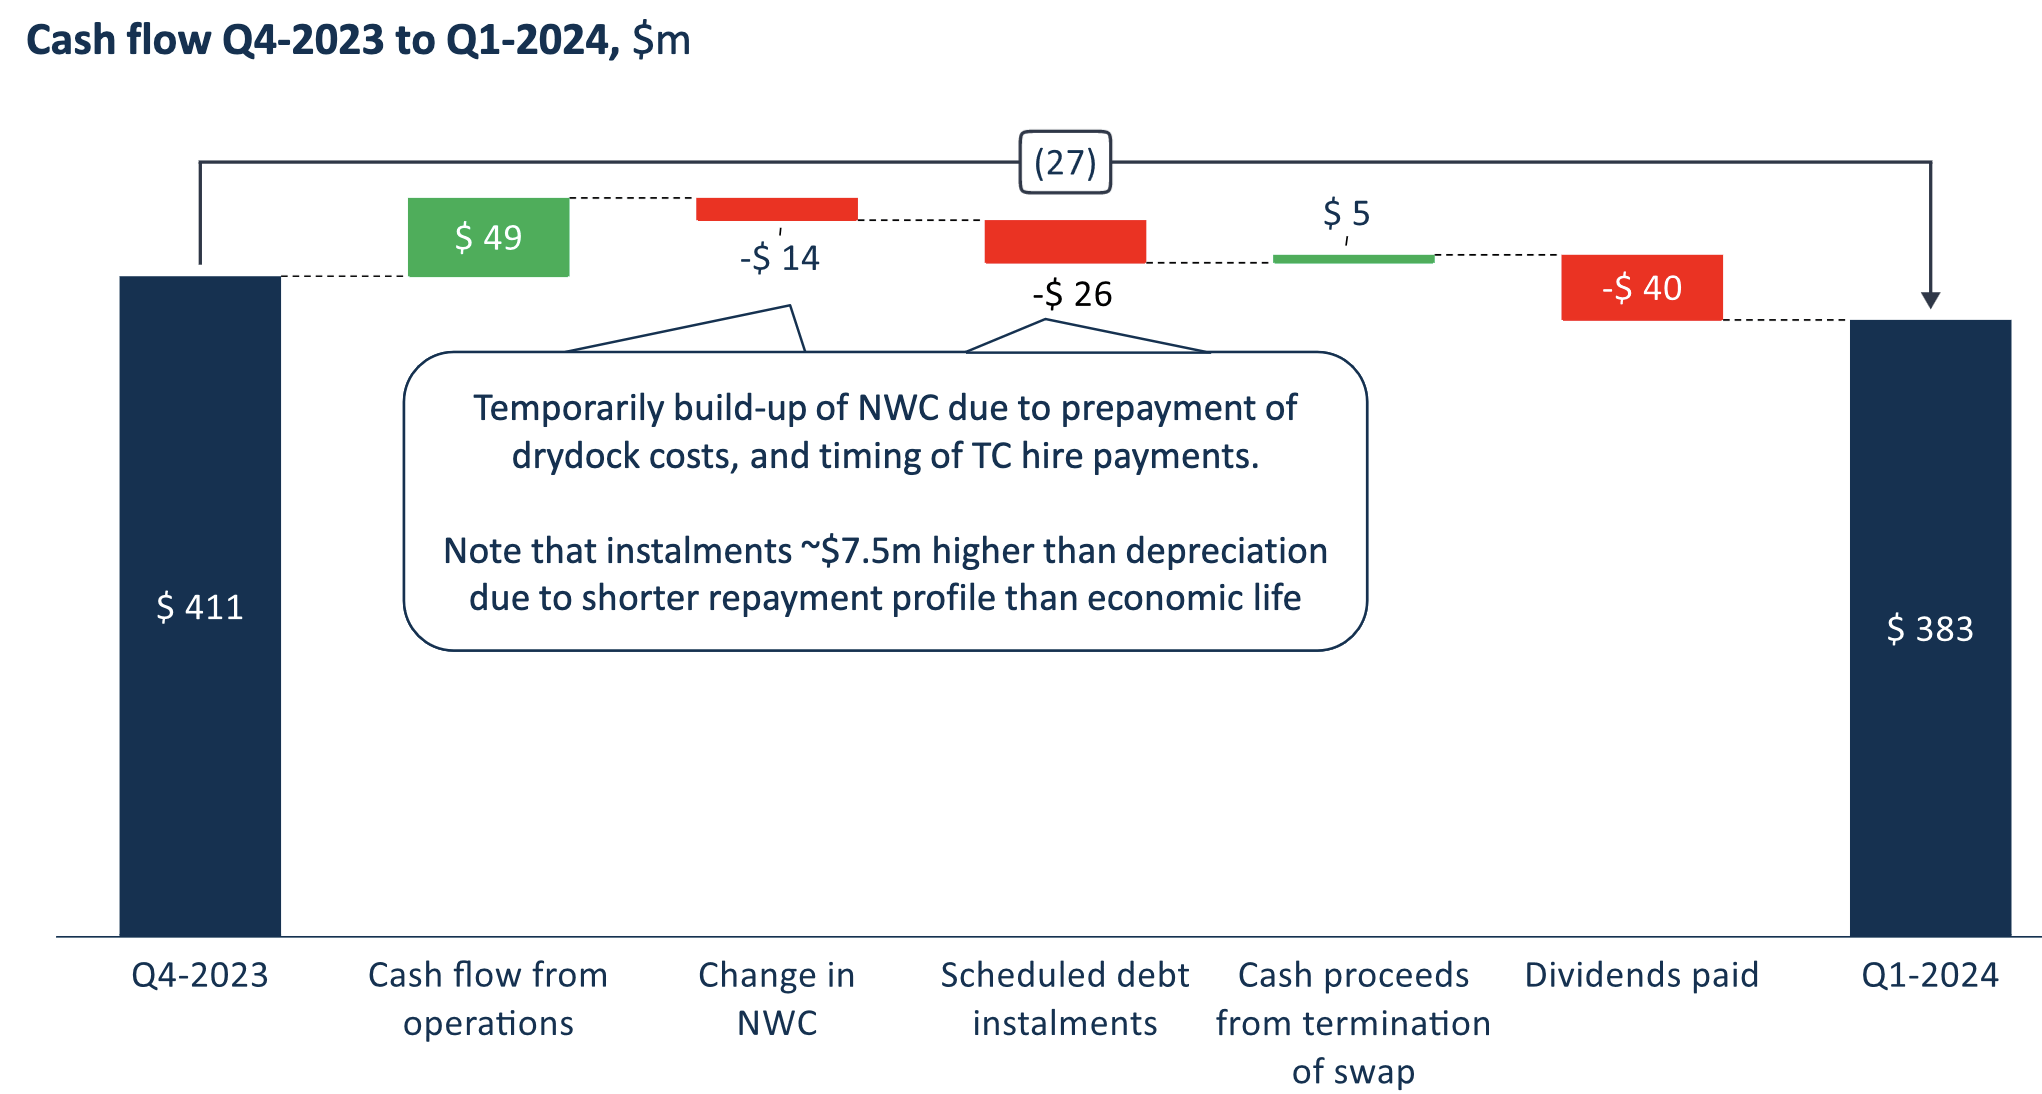
Profitability & Leverage:
ROA and ROE both rose again in Q1 ’24, after dropping in 2023, with ROA below Marine Shipping averages, and ROE slightly above them. The EBITDA Margin was stable, and much higher than average.
The Marine Shipping industry generally doesn’t use a great deal of leverage — FLNG’s Net Debt/EBITDA has been stable, but much higher than average in the past 2 years, while its Debt/Equity is also higher than average.
Hidden Dividend Stocks Plus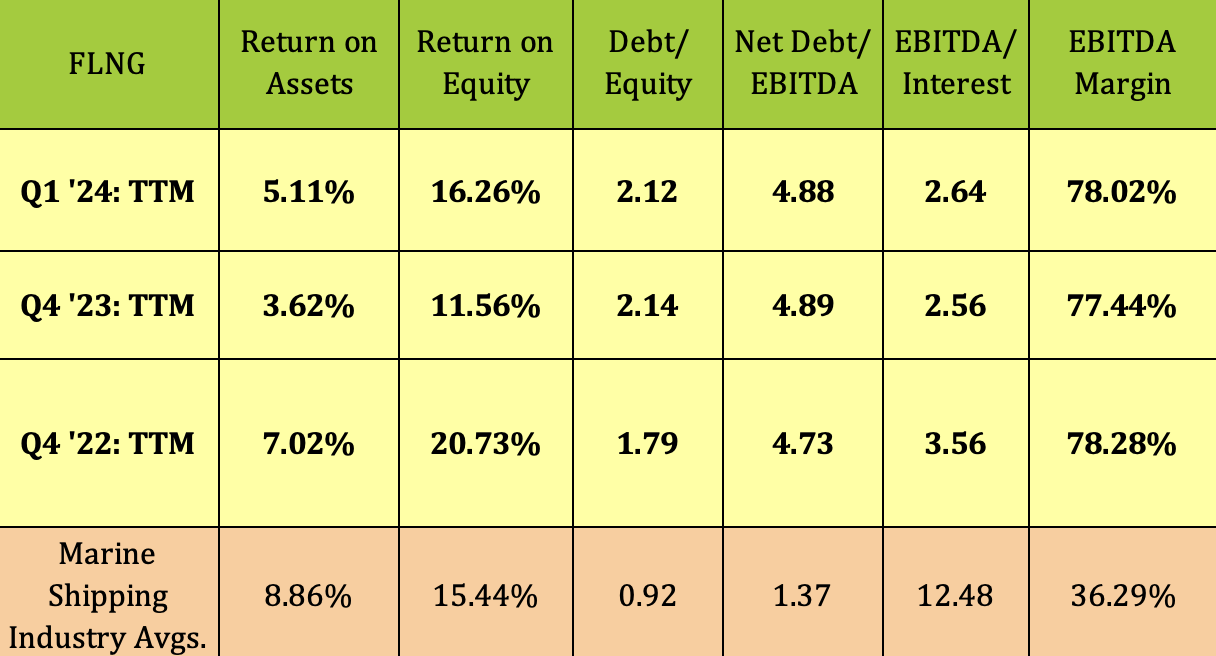
Debt & Liquidity:
Management uses a combo of fixed rate leasing, $898M, and debt, $888M, to finance the fleet, ~evenly split:
FLNG site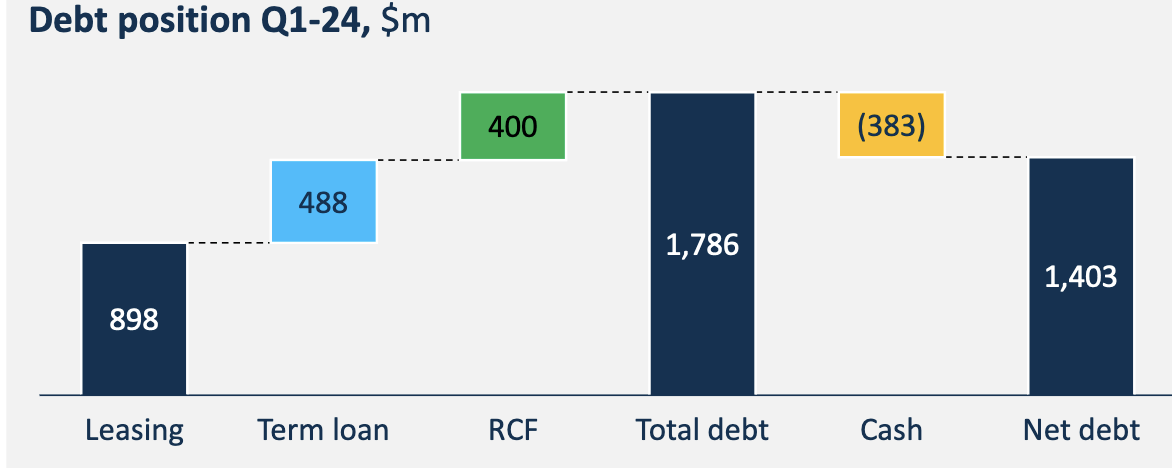
FLNG has no debt maturities until 2028, when 2 of its credit facilities come due.
FLNG site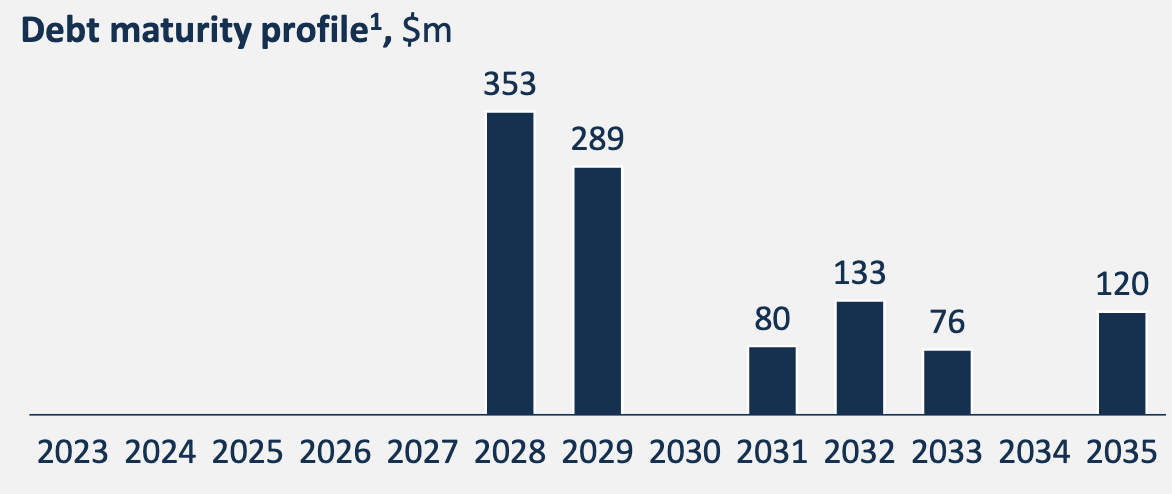
Performance:
FLNG has lagged its industry by wide margins over the past quarter, year, and so far in 2024. It has been one of the worst performers in its industry, due to concerns about possible dividend cuts.
“So we try to always measure kind of if we are buying other ships, we don’t want to impact our dividend capacity negatively. So if buying ships and getting a lower return on that, then paying our dividends is what we have to do, we rather pay out the dividend.” (Q1 call)
Hidden Dividend Stocks Plus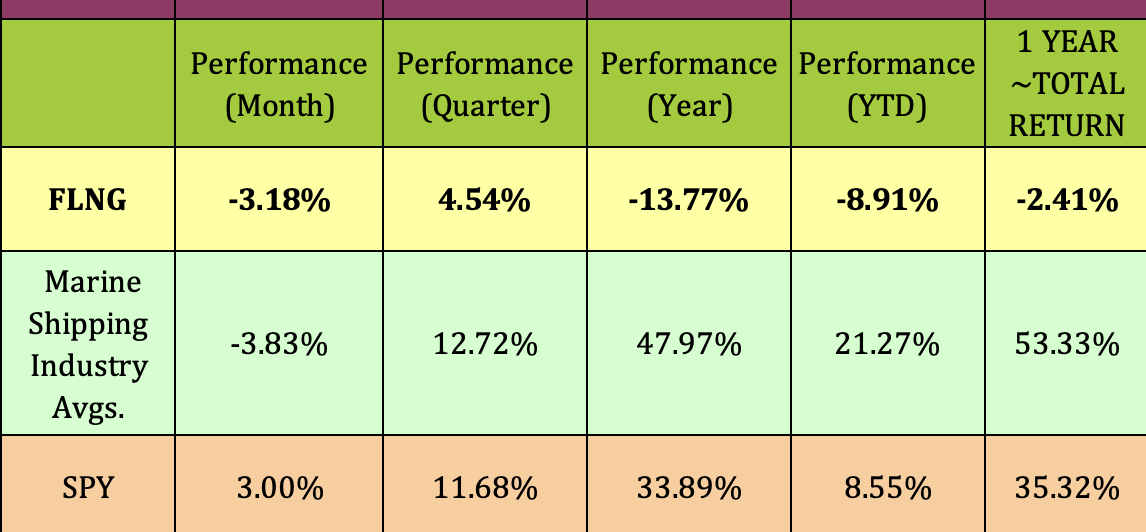
Analysts’ Price Targets:
FLNG got a downgrade from Jefferies in February ’24, from hold to underperform, with their target dropping from $32 to $23.
At $26.42, FLNG is ~below 15% above street analysts’ low target, and ~12% below the $29.92 average price target.
Hidden Dividend Stocks Plus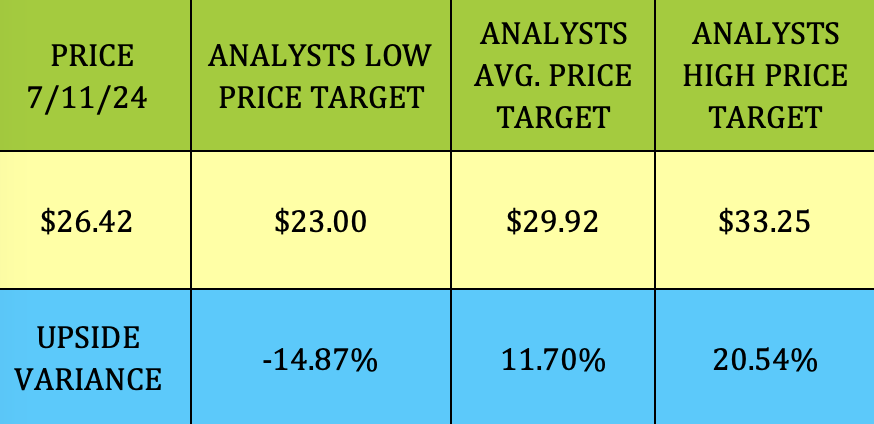
Valuations:
While its trailing P/E is cheaper than the industry average, FLNG’s forward 2025 P/E is much higher than average, as are its P/Sales, P/Book, and EV/EBITDA. Its dividend yield is over 2X the industry average.
Hidden Dividend Stocks Plus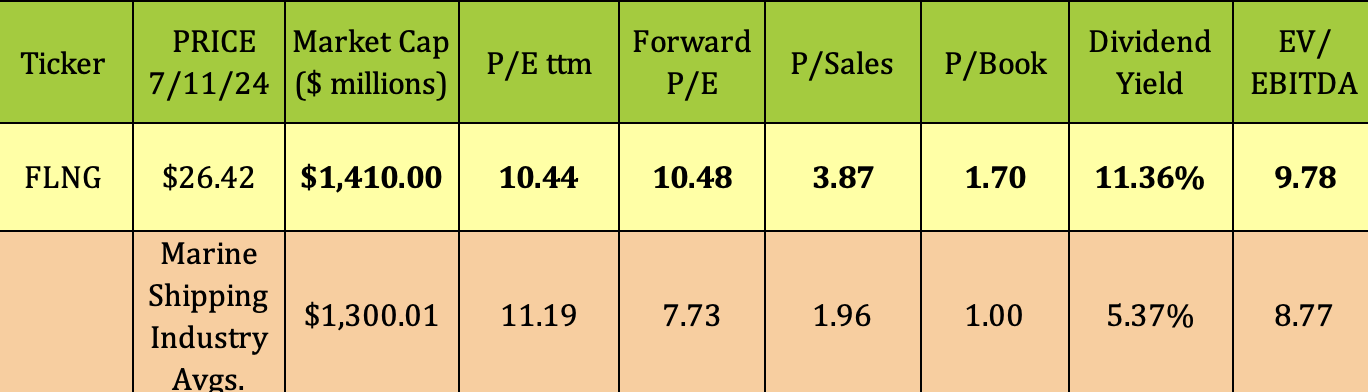
Parting Thoughts:
At $26.42, FLNG is ~9% above its 52-week low. It should declare the next quarterly dividend and report Q2 earnings in mid-August. We’re staying on the sidelines for now. Although FLEX LNG Ltd.’s business looks to be in a good place near term, we don’t see any undervaluation at present.
All tables furnished by Hidden Dividend Stocks Plus, unless otherwise not