Fundamental
Overview
Bitcoin rallied strongly
over the weekend after a failed
attempt to assassinate the former US President Trump. The market reacted
positively to the event because he’s been a supporter of the crypto industry
and Trump’s odds of winning the election soared.
Moreover, we got the news
that the German government finally offloaded all of its Bitcoin holdings on
July 12th, so that bearish driver is now in the rear-view mirror. Also, the old
crypto exchange Mt. Gox has been repaying its old clients since last week, so even
this news should now be priced in.
So, we are left with lots
of bullish drivers and very few bearish cases. On the macro level, the data
last week showed that the US disinflationary trend is intact and that the
labour market remains resilient. So, all else being equal, we are getting rate
cuts into resilient growth which should ultimately be bullish for Bitcoin.
Bitcoin
Technical Analysis – Daily Timeframe
Bitcoin Daily
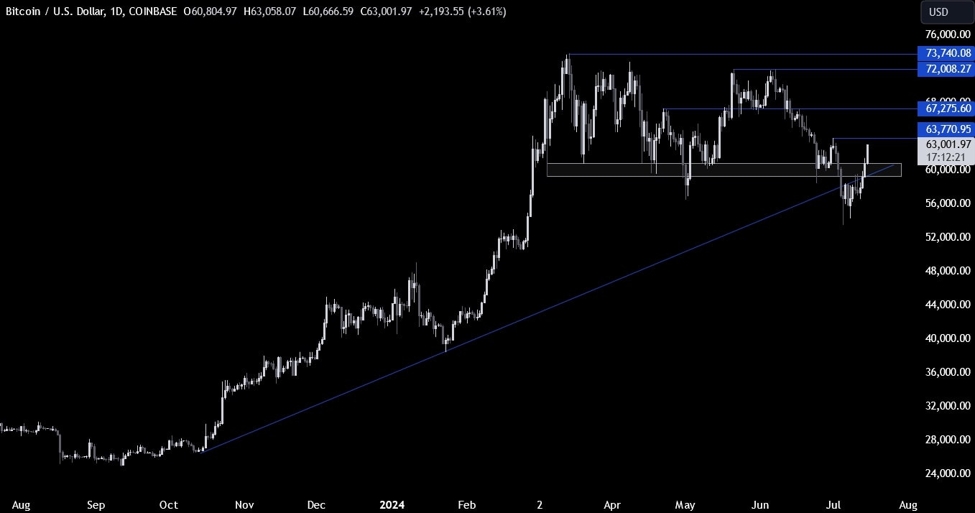
On the daily chart, we can
see that Bitcoin eventually managed to rally back above the key 60K zone leaving
behind a fakeout. This is generally a reversal signal, so the buyers might have
a bit more confidence now to start targeting a new cycle high.
The sellers, on the other
hand, will want to see the price falling back below the 60K zone and the major trendline
to regain control and increase the bearish bets into new lows.
Bitcoin Technical
Analysis – 4 hour Timeframe
Bitcoin 4 hour
On the 4 hour chart, we can
see that we got some breakouts over the weekend as the price broke through the
downward trendline and the 60K zone before extending the rally into the 63K
level as the bullish momentum increased.
From a risk management
perspective, the buyers will have a much better risk to reward setup around the
60K support
where they will also find the upward trendline for confluence.
The sellers, on the other hand, might step in around the 63-64K area to
position for a drop back into the 60K support and look for a breakout to the
downside to increase the bearish bets into new lows.
Bitcoin Technical Analysis – 1 hour Timeframe
Bitcoin 1 hour
On the 1 hour chart, we can
see that we have another minor trendline defining the current bullish momentum.
That could be another support for the buyers as it’s all about getting an entry
now that the market switched to a bullish bias. If the price were to fall below
the 58K level, the bullish bias would be invalidated. The red lines define the average daily range for today.
Upcoming
Catalysts
Today we have Fed Chair Powell speaking at the Economic Club of Washington, D.C.
Tomorrow, we get the US Retail Sales report. On Wednesday, we have Fed’s Waller
speaking and on Thursday we conclude with the latest US Jobless Claims figures.