Fundamental
Overview
The USD weakened across the
board last week following another soft US CPI report and benign Jobless Claims figures. The market not only fully
priced in a rate cut in September but also started to price in some chances of
a back-to-back rate cut in November.
Overall, we had a
goldilocks data release with an economy that is slowing but still growing. This
should support the soft-landing narrative and be positive for the risk
sentiment.
The AUD, on the other hand,
keeps on gaining against the US Dollar mainly because of the risk-on sentiment
as the US data continues to support at least two rate cuts from the Fed without
sending recessionary signals.
On the monetary policy
front, the Aussie got a boost from another hot monthly CPI report last month which raised the
chances of a rate hike. Things changed quickly though as RBA’s Hauser poured some cold water on the
expectations saying that he would rather hold rates steady for longer. That
suggests that the bar for a rate hike is very high, and the central bank is
more likely to keep rates higher for longer.
AUDUSD
Technical Analysis – Daily Timeframe
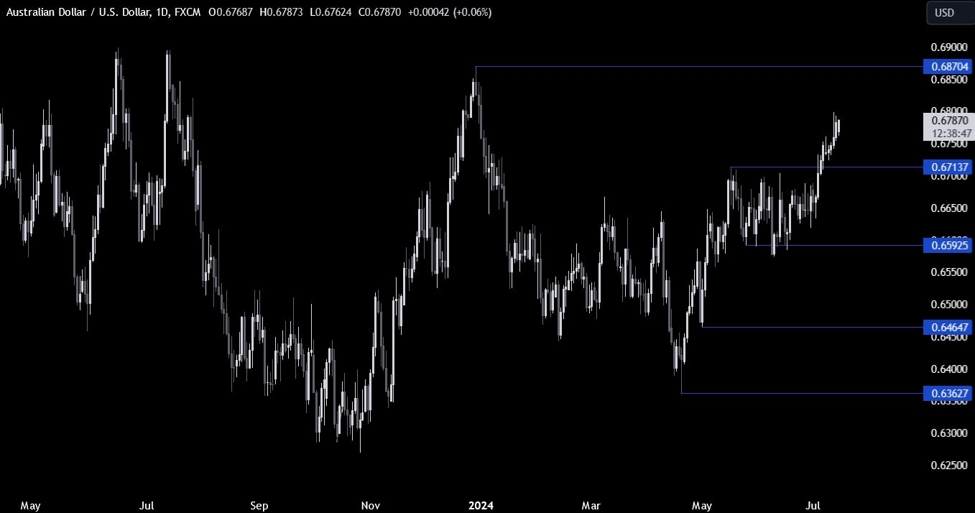
AUDUSD Daily
On the daily chart, we can
see that AUDUSD broke out of the two-month long range and after a brief consolidation,
increased the gains on goldilocks US data. The resistance around the 0.6713 level has now become support if the price were to fall back to
it.
From a risk management
perspective, the buyers will have a better risk to reward setup around the
0.6713 support but we will need some very negative catalyst to trigger such a
big pullback. This week it could be the US Retail Sales or the Australian
Labour Market report.
The sellers, on the other
hand, will need the price to fall back below the 0.6713 level to regain some
control and position for a drop into the 0.66 handle next.
AUDUSD Technical
Analysis – 4 hour Timeframe
AUDUSD 4 hour
On the 4 hour chart, we can
see that we have a minor upward trendline
defining the current bullish momentum. We can expect the buyers to lean on the
trendline if the price were to pull back to it. The sellers, on the other hand,
will want to see the price breaking lower to position for a drop into the
0.6713 support.
AUDUSD Technical
Analysis – 1 hour Timeframe
AUDUSD 1 hour
On the 1 hour chart, we can
see that the price got stuck in another consolidation recently with the price
action forming what looks like a symmetrical triangle. The price can break on
either side of the pattern but what follows next is generally an increase in
momentum in the direction of the breakout. The red lines define the average daily range for today.
Upcoming
Catalysts
Today we have Fed Chair Powell speaking at the Economic Club of Washington,
D.C. Tomorrow, we get the US Retail Sales report. On Wednesday, we have Fed’s
Waller speaking and on Thursday we conclude with the Australian Labour Market
report and the latest US Jobless Claims figures.


