
deepblue4you
While we have seen stock market leadership concentrated in mega caps, funds like Invesco RAFI Strategic US ETF (NASDAQ:IUS) offer a different approach, weighing stocks based on operational metrics, such as sales, cash flow, and book value, unlike market-cap weighted benchmark indexes.
This approach used by IUS gives this ETF a tilt toward value, given its low valuation metrics, and also provides higher exposure to companies and sectors that can benefit from broadening the stock market gains over the coming months. That said, I see IUS as an interesting alternative for investors looking for value and diversified investment strategies.
ETF Description & Highlights
IUS is an exchange-traded fund that aims to offer exposure to high-quality, large-size companies in the U.S. market, replicating the allocation of the underlying Invesco Strategic US index.
Starting with a universe of U.S. stocks with at least one year of trading history, the Invesco Strategic US index’s methodology assigns a business-size score to each security based on the average of four factors over the previous five years: 1) Sales, 2) Operating cash flow, 3) Total return of capital, and 4) Book value. Then, the first screen is created by selecting the top 90% of the initial universe of eligible stocks.
After the first screen, a second filter is applied to select the top 80% of the remaining eligible stocks, following a quality score. This quality score is calculated as the average of two quality factors: 1) Efficiency (sales-to-assets ratio over the previous year) and 2) Growth (percentage of the sales-to-assets ratio over the previous five years).
After these two screens, the selected stocks will compose the Invesco Strategic US index, and the weight of each stock will be based on its business-size score. The rebalance and reconstitution are made annually.
As of July 11, 2024, IUS has allocations in 552 companies, following the underlying Invesco Strategic US Index, with an average market cap of $146.9 billion. Of these, 31.9% of total assets are composed of mega caps, 36.0% of large caps, 25.8% of mid caps, and only a marginal exposure of 5.5% in small caps.
This allocation is relatively more skewed to large caps rather than mega caps compared to the Russell 1000 index, a benchmark for large-cap companies in the U.S market, here represented by the iShares Russell 1000 ETF (IWB). This benchmark has an average market cap of $250.2 billion, and heavier allocation to mega caps, with 43.3% of total assets and 31.9% in large caps. Both IUS and the Russell 1000 index are primarily composed of larger capitalization companies, as mid and small caps represent less than one-third of the total composition.
IUS’s top ten holdings (Apple, Alphabet, Microsoft, Berkshire Hathaway, Exxon Mobil, Meta, Amazon, Chevron, AT&T, and UnitedHealth) represent 26% of total assets and are a mix of big tech names and some value players, such as Berkshire, Exxon and Chevron.
Morningstar, consolidated by the author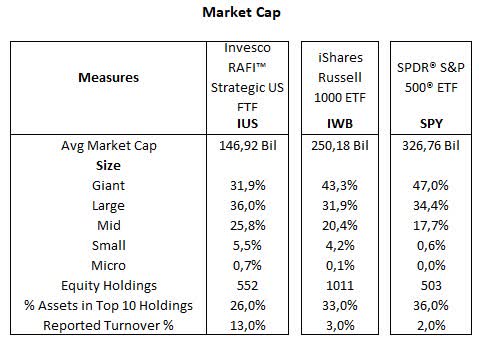
Below is a comparison between IUS and a peer group of large-cap ETFs with a fundamental approach. The first and the third ETFs (FNDX and IUS) follow RAFI indexes with a fundamental approach. PMV and VTV are both value-oriented funds, with PMV being quite a concentrated fund with only 50 holdings. Meanwhile, JQUA follows a methodology skewed to quality, and FFLC is an actively managed ETF.
Curiously, IUS and the peer group average have relatively similar exposures across different equity sizes, with few disparities, such as FFLC’s higher allocation to mega caps.
Morningstar, consolidated by the author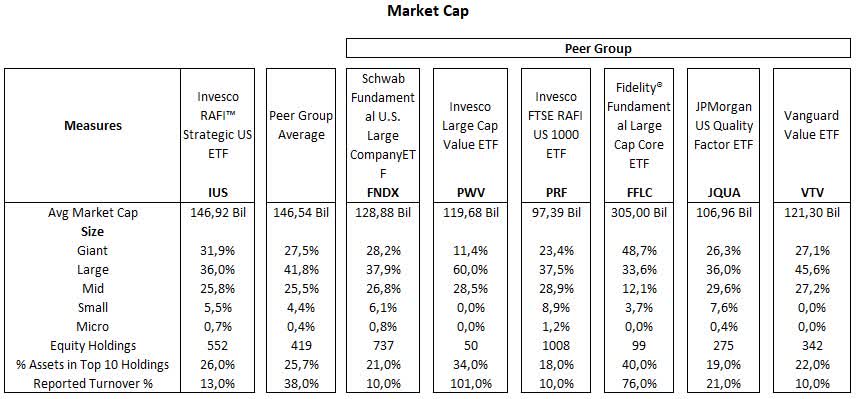
From a sector allocation perspective, IUS‘s largest allocation is to the technology sector, with 19.6% of total equities, followed by healthcare with 14.4%, communication services 12.2%, consumer cyclical 12.1%, energy 10.4%, industrials 9.7%, consumer defensive 8.3%, financial services 8.1%, basic materials 3.4%, utilities 1.2%, and real estate 0.6%. Relative to the Russell 1000 index, IUS is overweight in energy (+6.8%), communication services (+3.3%), and healthcare (+2.9%), but heavily underweight in technology (-12.8%), and financial services (-4.3%).
Morningstar, consolidated by the author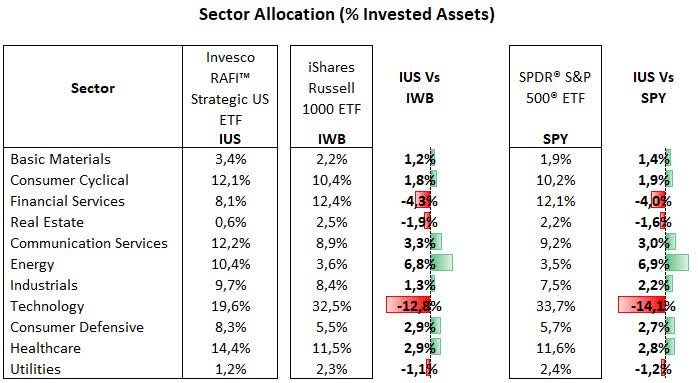
Compared to the peer group of large caps ETFs, IUS is overweight in communication services and consumer cyclical. Meanwhile, underweight allocations are concentrated in financial services and utilities. IUS’s divergence relative to the peer group resonates with its underlying index methodology, where the business-size score includes metrics such as sales and operation cash flow, while the quality score focuses on efficiency and growth rather than valuations. Thus, it comes as no surprise that IUS has a higher allocation in profitable and large revenue generation companies in the communication services industry, as opposed to low multiple sectors, such as financials and utilities.
Morningstar, consolidated by the author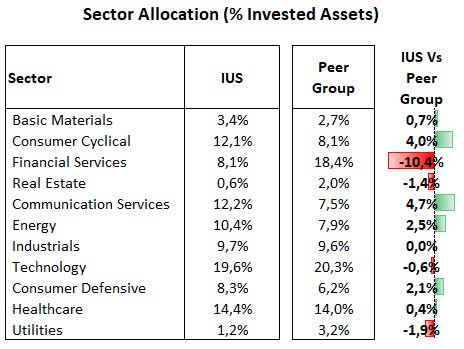
IUS’s multiples are considerably lower than those of the Russell 1000 and the S&P 500 indexes. For instance, IUS has a P/E ratio of 16.3x, 25% lower than 22.0x for the benchmark. This is in large part explained by IUS’s low exposure to a premium sector such as technology coupled with its overweight allocation to lower multiple sectors such as energy, consumer staples and healthcare.
Morningstar, consolidated by the author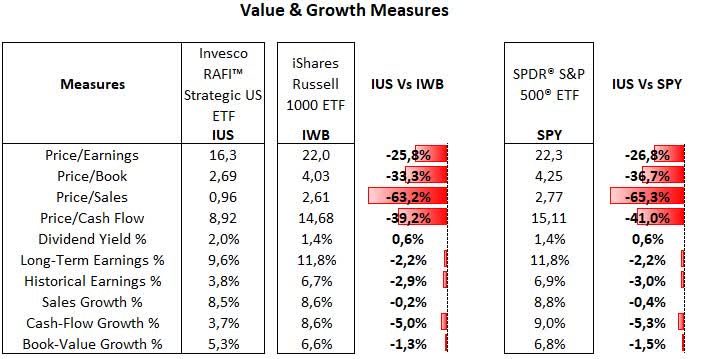
Relative to the peer group, while IUS’s P/E ratio is similar to peers, other valuation ratios are substantially lower, as the underlying index methodology assigns greater importance to measures such as book value, sales, and cash flow.
Morningstar, consolidated by the author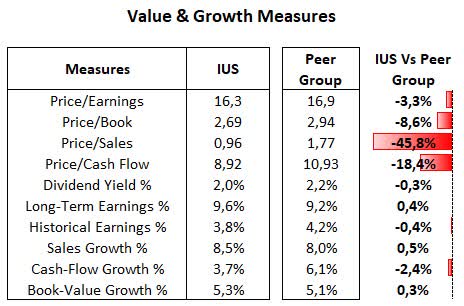
Short-Term Underperformance Dragged Down by Low Allocation In Nvidia
IUS’s total return has been overall positive over the long term, slightly outperforming the Russell 1000 index and the peer group. However, that has not been the case in the last year, as the fund gained 20.4% versus 26.4% for the Russell 1000 index.
This underperformance is mainly due to just one reason: IUS’s low exposure to Nvidia, which represents only 0,90% of IUS’s total capital, versus 5.9% for the Russell 1000 index, as IUS has not captured Nviodia’s skyrocket gains of 194% over the past 12 months. Thus, shares of Nvidia contributed only 2,8% of IUS’s returns over this period, while it accounted for nearly 11.5% for the Russel 1000 index, representing an 8.6% gap just because of this stock. Discounting the influence of Nvidia, IUS’s performance would be 17.6% versus 14.9% for the Russell 1000 index over the last 12 months.
Morningstar, consolidated by the author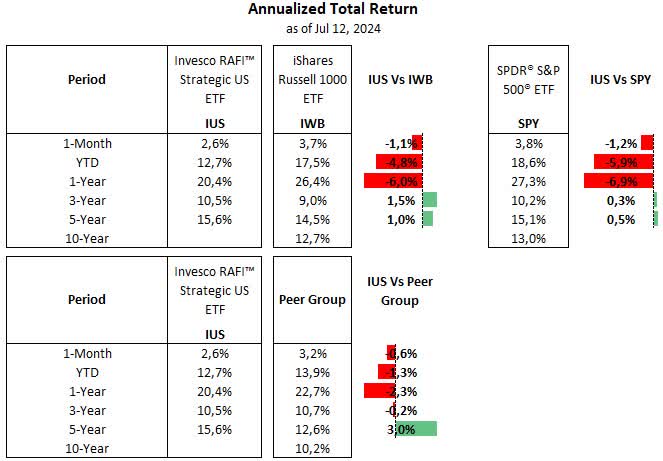
IUS’s stock allocation has led to lower volatility compared with the Russell 1000 and the S&P 500 indexes, as evidenced by its lower beta, standard deviation, and maximum drawdown. This resulted in better risk-adjusted returns on a relative basis, as measured by the Sharpe Ratio.
Morningstar, consolidated by the author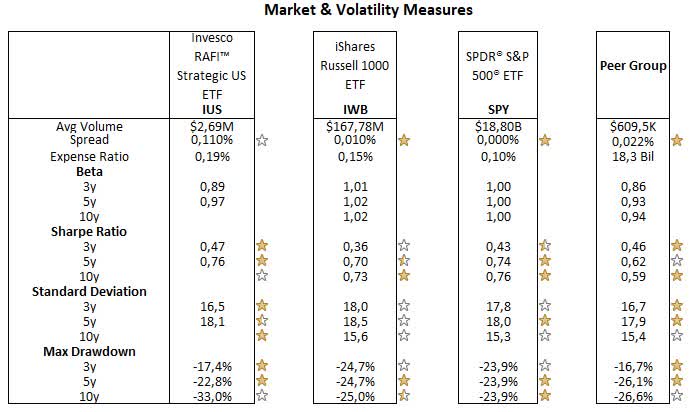
In conclusion, the allocation strategy adopted by IUS’s underlying index has created a dynamic that avoids an overwhelming allocation to mega caps, as the index uses operational metrics to weigh stocks, such as sales, cash flow, and book value, rather than the market cap. Nevertheless, big tech companies like Apple, Alphabet, Microsoft, and Amazon are still within its top ten holdings, while an overweight exposure to energy, healthcare, and consumer staples gives IUS a tilt toward value, as evidenced by its low valuation multiples.
That said, while its low allocation to Nvidia has been detrimental to performance over the last 12 months, and that could very well remain the case in the foreseeable future, as a narrow market leadership can continue for an extended period of time. IUS looks well-positioned for a potential broadening in the stock market gains, once the start of an easing rate cycle can benefit other sectors out the technology.