Fundamental
Overview
Gold has been on a
steady retreat since hitting a new all-time high on Wednesday. The price
tonight fell below the previous key resistance at 2430 level, and some
might start questioning if this is just a pullback or the breakout was in
reality a fakeout.
As of now, it looks like gold have limited downside but lots of upside as
inflation abates slowly while risks to the growth picture increase the longer
the Fed keeps policy restrictive. In the short-term, strong US data might weigh
a bit on the market, but in the long-term weak data is likely to trigger bigger
upside moves.
Gold
Technical Analysis – Daily Timeframe
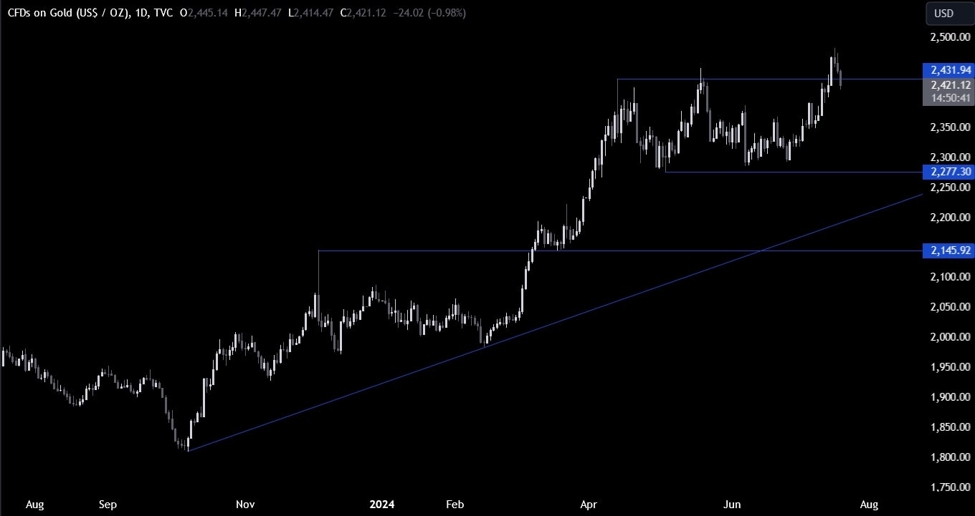
Gold Daily
On the daily chart, we can
see that gold fell below the 2430 level overnight without any clear catalyst.
The sellers might now start to pile in with a defined risk above the 2430 level
to position for a drop back into the 2277 support. The buyers, on the other hand, will likely
look for dip-buying opportunities on the lower timeframes.
Gold Technical Analysis – 4 hour Timeframe
Gold 4 hour
On the 4 hour chart, we can
see that the price has now pulled back to the trendline that’s been defining the bullish
momentum since the beginning of July. This is where we can expect the buyers to
step in to position for the continuation of the uptrend. The sellers, on the
other hand, will want to see the price breaking lower to increase the bearish
bets into the 2277 support.
Gold Technical Analysis
– 1 hour Timeframe
Gold 1 hour
On the 1 hour chart, we can
see that the price is near the lower bound of the average daily range, which makes it a nice risk to
reward setup for the buyers. Today we don’t have any notable economic release
on the agenda.