Fundamental
Overview
Copper experienced a strong rout last week with market participants blaming
the soft Chinese economic
data and the increase in inventories in most global warehouses suggesting some
weak demand.
The PBoC tonight surprised with rate cuts across many key
benchmarks. Moreover, the recent PBoC policy framework reform suggests that the
Chinese officials could take more actions to spur growth.
In the big picture, stable global growth and major central banks cutting
rates into resilient economies should be bullish drivers for the copper market and
more expansionary policies from Chinese officials might give an even stronger boost.
Copper
Technical Analysis – Daily Timeframe
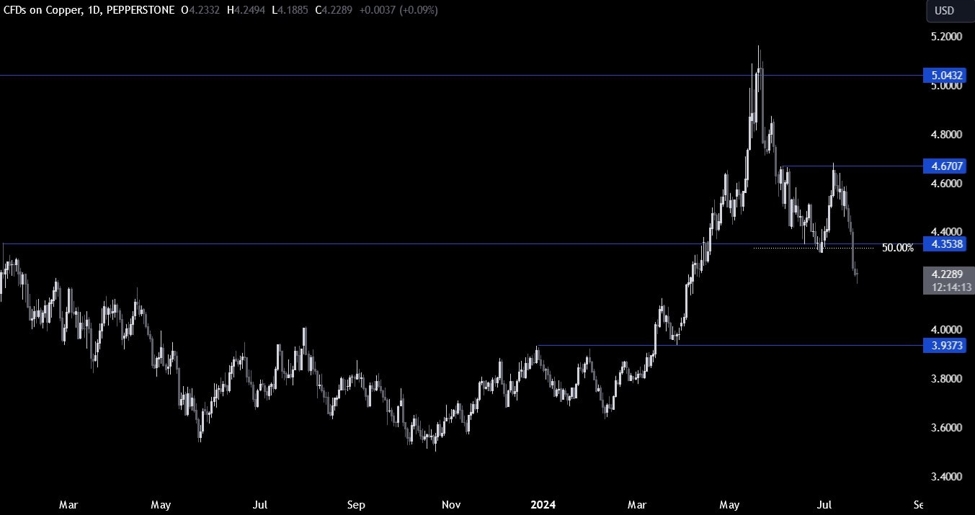
Copper Daily
On the daily chart, we can
see that copper eventually broke through the key 4.35 support where we had also the 50% Fibonacci retracement level for confluence, and extended the drop into the
4.21 level.
There’s not much else to glean
from this timeframe as the sellers might want to see a pullback before piling
back in while the buyers will look for opportunities on the lower timeframes to
position for a rally back above the 4.35 level.
Copper Technical
Analysis – 4 hour Timeframe
Copper 4 hour
On the 4 hour chart, we can
see that from a risk management perspective, the sellers will have a much
better risk to reward setup around the 4.35 level where they can step in with a
defined risk above the resistance. The buyers, on the other hand, will want to
see the price rising back above the 4.35 resistance to increase the bullish
bets into the 4.67 level next.
Copper Technical
Analysis – 1 hour Timeframe
Copper 1 hour
On the 1 hour chart, we can
see that the recent price action formed what looks like a falling
wedge. This is generally a reversal pattern, so the buyers will want to see
the price breaking above the minor downward trendline
to pile in for a move higher.
The sellers, on the other
hand, will likely keep on leaning on the minor trendline to keep pushing lower
but if the price were to break higher, the next entry point for the sellers
should be the trendline around the 2.28 level. The red lines define the average daily range for today.
Upcoming
Catalysts
This week is pretty empty on the data front. We begin on Wednesday with the
release of the US Flash PMIs. On Thursday, we will get the latest US Jobless
Claims figures. Finally, on Friday we conclude the week with the US PCE report.