Fundamental
Overview
Bitcoin rallied strongly last
week after a failed attempt to assassinate the former US
President Trump. The market reacted positively to the event because he’s been a
supporter of the crypto industry and Trump’s odds of winning the election
soared.
Last night, the price of
Bitcoin dipped on the news that Biden
dropped out of the presidential race probably on expectations that some
other candidate could have higher chances of beating Trump, but as Biden endorsed
Kamala Harris and others followed suit, Bitcoin erased the losses and rallied
into a new high as the market doesn’t expect Harris to have any better chances of
beating Trump.
Moreover, last week we got
the news that the German government finally offloaded all of its Bitcoin
holdings on July 12th, so that bearish driver is now in the rear-view mirror.
Also, the old crypto exchange Mt. Gox has been repaying its old clients since the
first week of July, so even this news should now be priced in.
So, we are left with lots
of bullish drivers and very few bearish reasons. On the macro level, the
soft-landing narrative strengthened as we continue to see inflation falling while
the economy continues to grow. Last week, we got more positive data with US Retail Sales and Industrial Production beating expectations by a big margin.
So, all
else being equal, we are getting rate cuts into resilient growth which should
ultimately be bullish for Bitcoin.
Bitcoin
Technical Analysis – Daily Timeframe
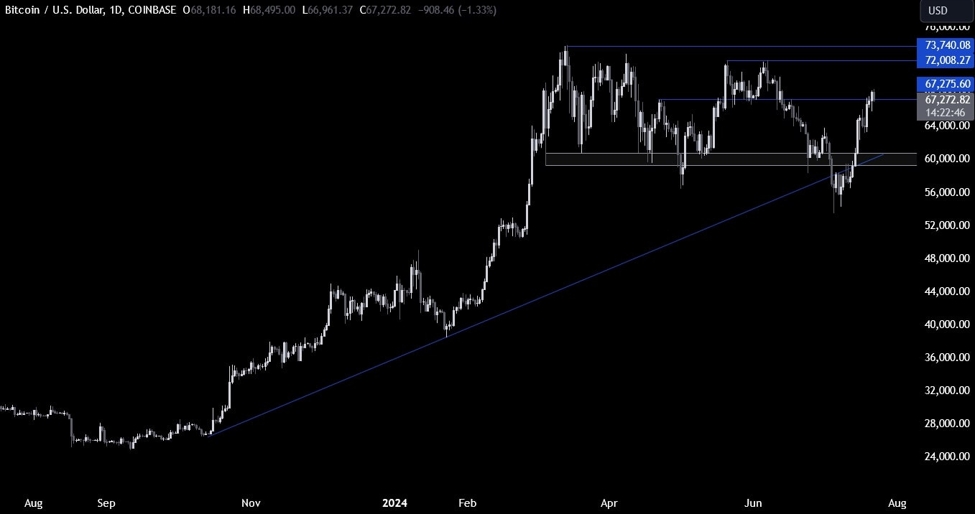
Bitcoin Daily
On the daily chart, we can
see that Bitcoin eventually extended the rally into the key 67.275 resistance
as the bearish drivers dissipated while the bullish reasons increased. The buyers
will want to see the price breaking above the resistance to increase the
bullish bets into a new cycle high. The sellers, on the other hand, will likely
step in around the resistance to position for a drop back into the 60000
support.
Bitcoin Technical
Analysis – 4 hour Timeframe
Bitcoin 4 hour
On the 4 hour chart, we can
see that the price is struggling a bit at the resistance. If we get a pullback
from these levels, we can expect the buyers to step back in around the 64000
level where we can find the confluence
of the previous swing high, the trendline
and the 38.2% Fibonacci
retracement level. The sellers, on the other hand, will want to see the
price breaking below the trendline to increase the bearish bets into the 60K
level next targeting a breakout.
Bitcoin Technical
Analysis – 1 hour Timeframe
Bitcoin 1 hour
On the 1 hour chart, we can
see that we have some consolidation around the key resistance. We got a spike
lower yesterday on the news that Biden dropped out from the presidential race,
but the buyers bought the dip back quickly. There’s not much else to glean from
this timeframe but the buyers will likely continue to pile in above the 67275
resistance, while the sellers should take back control with a break below the
65700 level. The red lines define the average daily range for today.
Upcoming
Catalysts
This week is pretty empty on the data front. We begin on Wednesday with the
release of the US Flash PMIs. On Thursday, we will get the latest US Jobless
Claims figures. Finally, on Friday we conclude the week with the US PCE report.