
The CryptoQuant Head of Research has explained how the demand for Bitcoin could be in its early stages of recovery, as per on-chain data.
Bitcoin Apparent Demand Metric Has Shown Early Signs Of Flipping
In a new post on X, Julio Moreno, the Head of Research at the on-chain analytics firm CryptoQuant, discussed the growth in demand for Bitcoin.
The indicator of interest here is the “Apparent Demand,” which takes the difference of two other metrics to measure the demand BTC is observing right now.
The metrics in question are daily block subsidy and daily change in the one-year inactive supply. The first is a measure of the amount the miners get in block rewards daily.
These rewards are the only possible way of minting more cryptocurrency, so the daily block subsidy reflects the fresh BTC entering into circulation daily.
The second relevant metric keeps track of the daily net change in the 1-year inactive supply of the asset. A positive change in the metric suggests a net number of coins surpassed an age of one year on that day, while a negative one implies dormant supply has been moved.
The Apparent Demand subtracts this change in the 1-year supply from the daily block subsidy to get an estimation of the demand that’s present for the cryptocurrency.
Now, here is the chart shared by Moreno that shows the trend in the 30-day sum for the Bitcoin Apparent Demand since the start of the year:
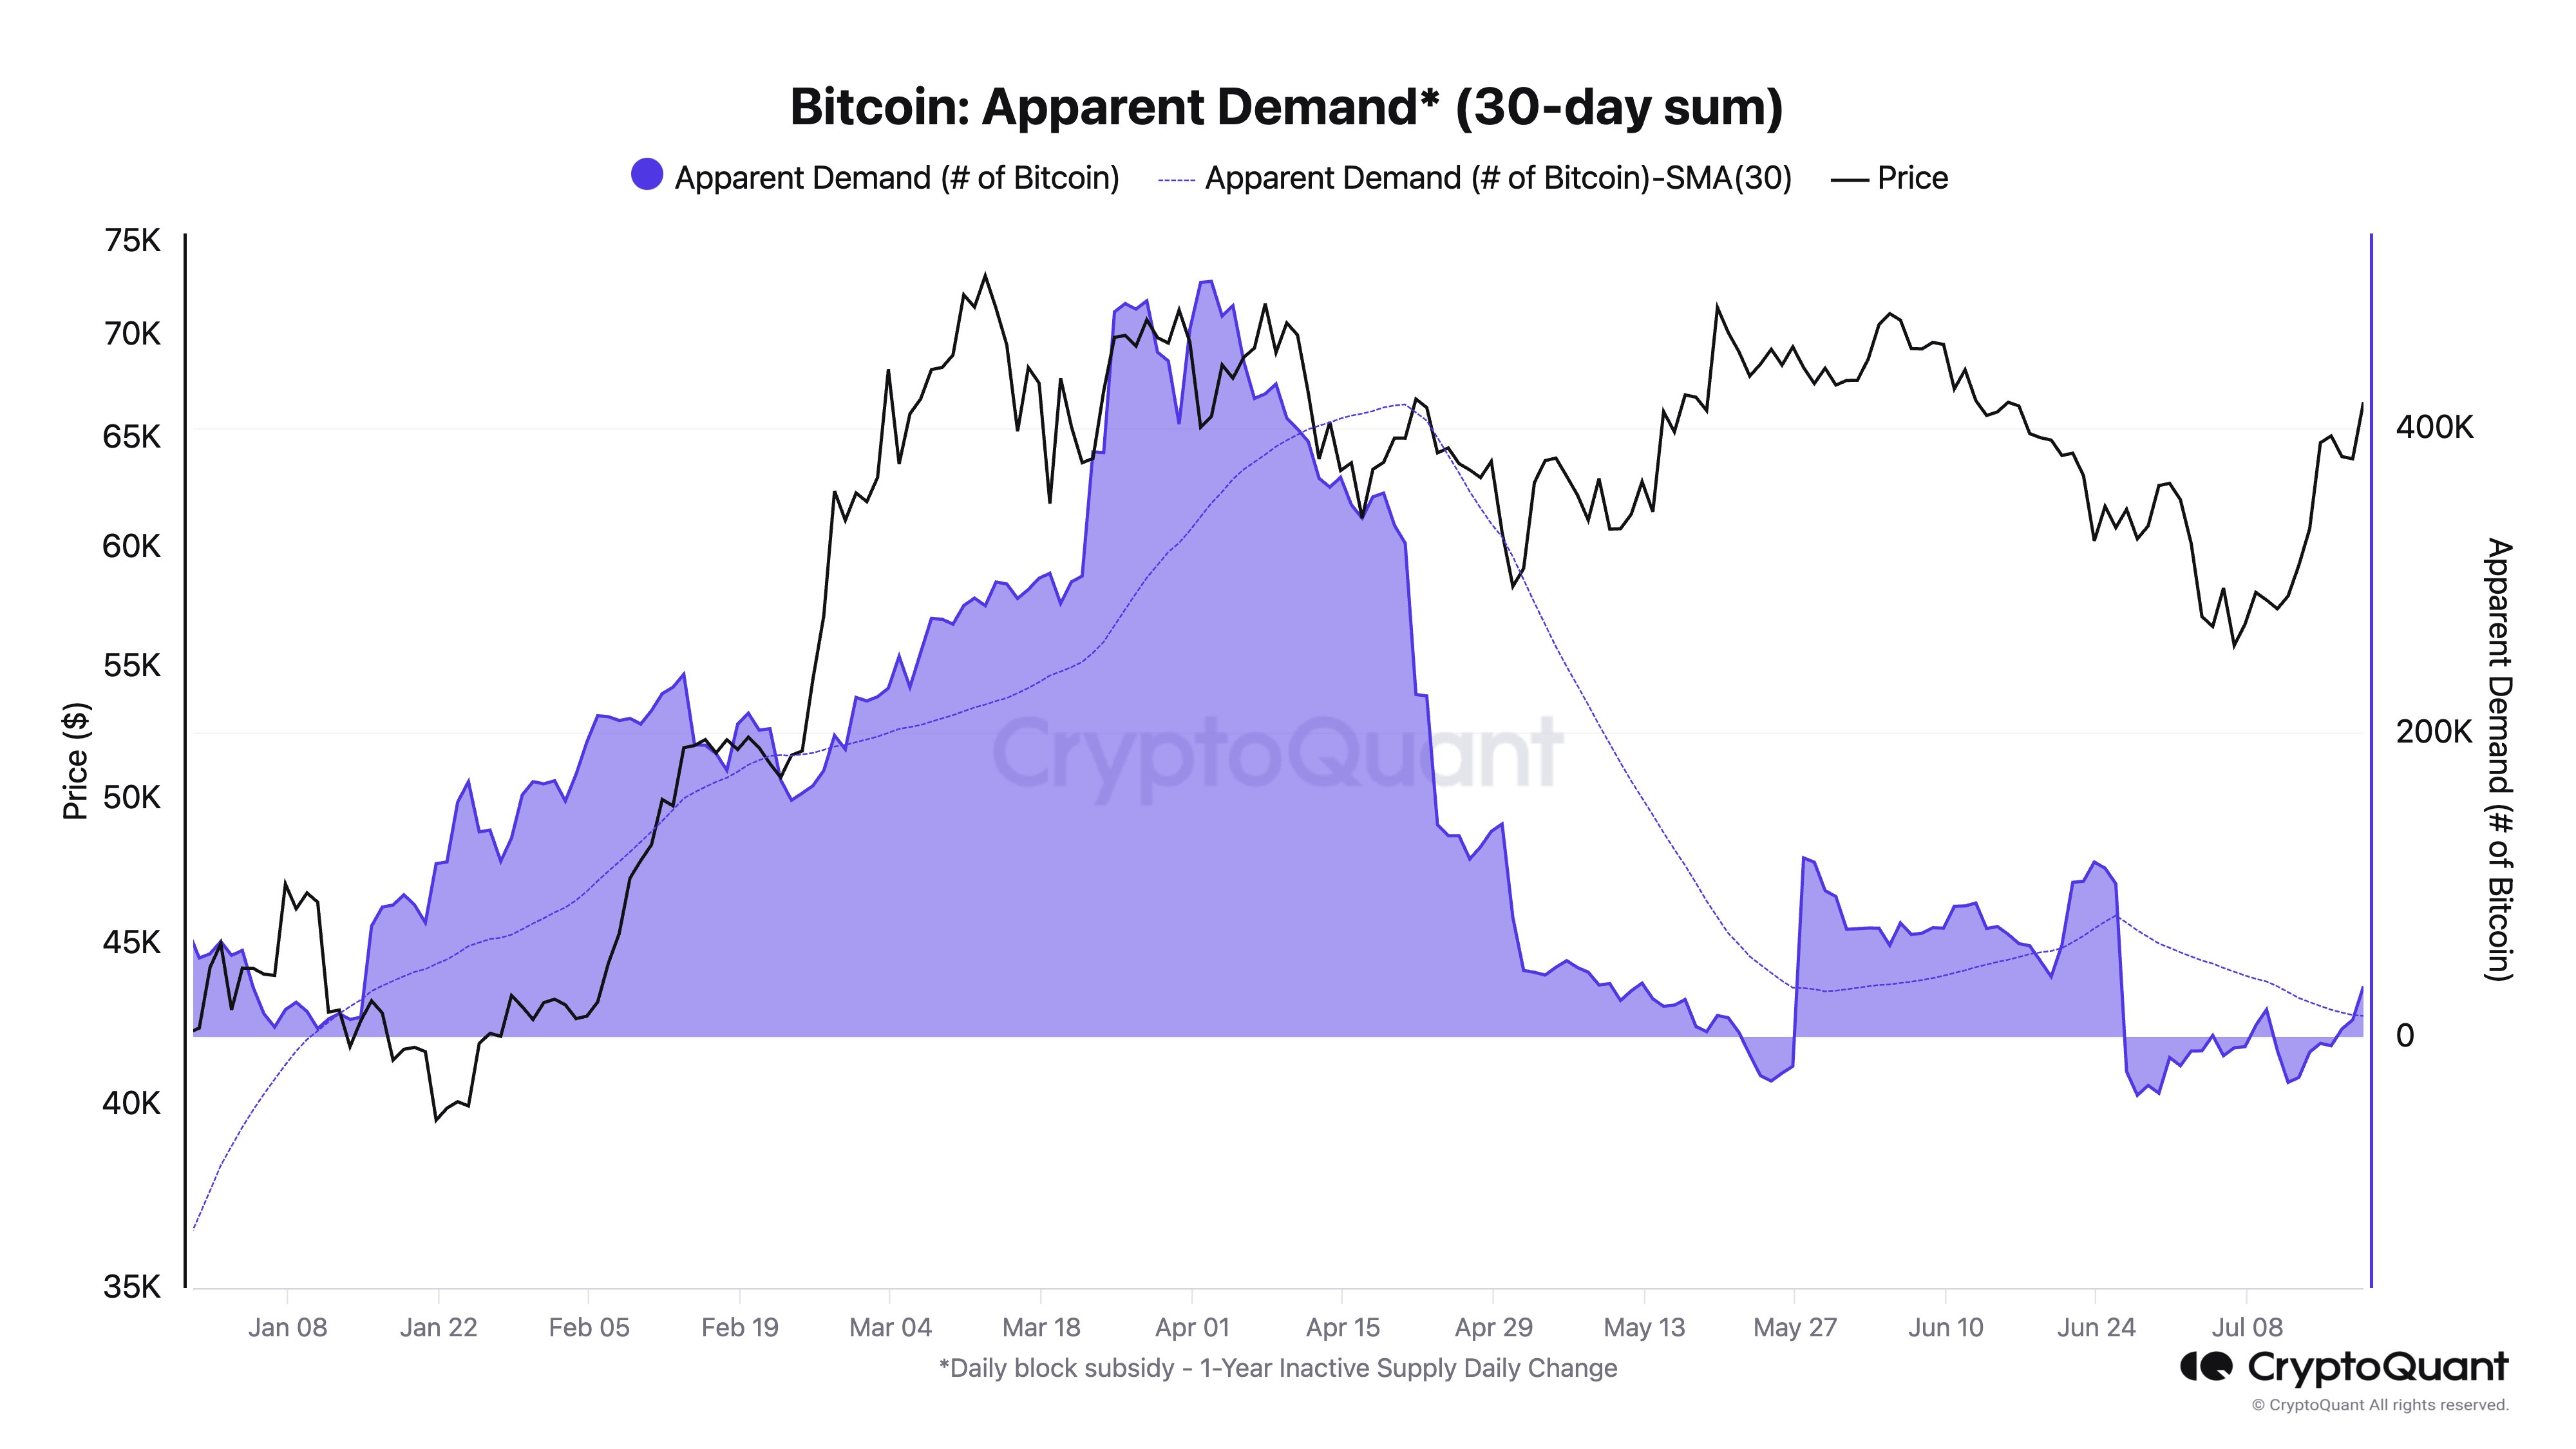
Looks like the value of the metric has just flipped positive in recent days | Source: @jjcmoreno on X
As displayed in the above graph, the Bitcoin Apparent Demand had been negative earlier in the month, but the metric has just returned positive. More importantly, the indicator has also managed to break above its 30-day simple moving average (SMA) with this surge.
The chart shows that the metric’s value had been at significant positive levels during the rally towards the new all-time high (ATH) earlier in the year, meaning that the high demand sustained the surge.
As such, this latest reversal in the indicator could also turn out to be bullish for the asset’s price. So far, though, the indicator’s value is relatively low, suggesting that a potential recovery could still be in its early phase. The CryptoQuant head notes that this could be something to monitor in the coming weeks.
BTC Price
The recent recovery in demand has come as the Bitcoin price has seen a notable rally over the past couple of weeks, rising from a low of $54,000 to just under $68,000.
The price of the asset appears to have been riding sharp bullish momentum recently | Source: BTCUSD on TradingView
Featured image from Dall-E, CryptoQuant.com, chart from TradingView.com