Fundamental
Overview
The Russell 2000 has been on an incredible run ever since the last US CPI report. The goldilocks
data was the catalyst for a strong rotation from big cap stocks into the small
cap stocks, and the momentum was probably exacerbated by hedge funds facing
short squeezes on their small cap hedges as yields came down.
More recently, we finally got
a pullback which wasn’t triggered by any negative catalyst, so it might be an
opportunity to buy the dip. On the monetary policy side, nothing has changed as
the market continues to expect at least two rate cuts by the end of the year
and sees some chances of a back-to-back cut in November.
The data continues to
suggest that the US economy remains resilient with inflation slowly falling
back to target. Overall, this should continue to support the soft-landing
narrative and be positive for risk sentiment. There’s also a new driver as
Trump is looking more and more like a potential winner and his policies are
seen as good for growth, although that could see the Fed eventually going even
more slowly on rate cuts on inflationary fears.
Russell 2000
Technical Analysis – Daily Timeframe
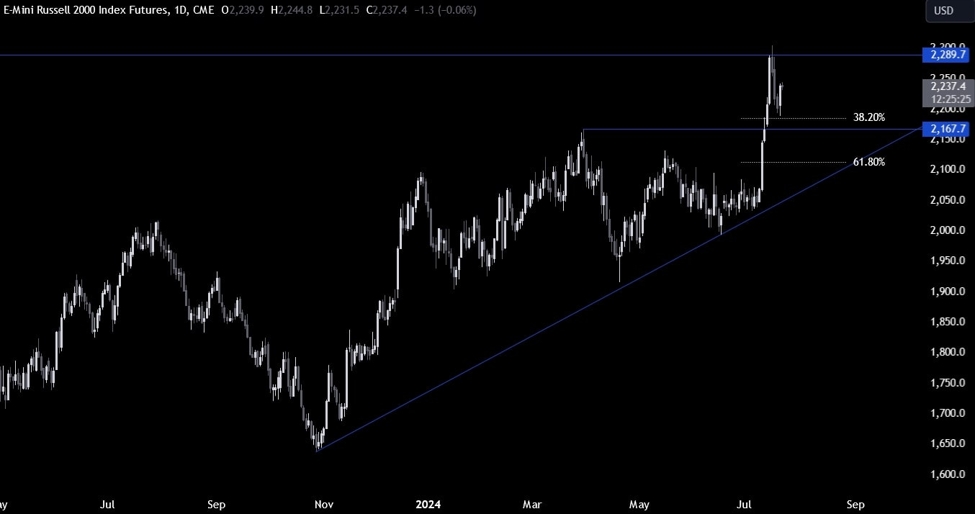
Russell 2000 Daily
On the daily chart, we can
see that the Russell 2000 bounced around the support around the 2170 level where we had the confluence of the previous swing high and the
38.2% Fibonacci retracement level.
The buyers stepped in with
a defined risk below the level to position for a new cycle high. The sellers,
might want to wait for the price to break below the 2170 support to increase
the bearish bets into the major trendline around the 2100 level.
Russell 2000 Technical
Analysis – 4 hour Timeframe
Russell 2000 4 hour
On the 4 hour chart, we can
see the strong bounce yesterday around the Fibonacci retracement level. There’s
not much else to glean from this timeframe so we need to zoom in to see some
more details.
Russell 2000 Technical
Analysis – 1 hour Timeframe
Russell 2000 1 hour
On the 1 hour chart, we can
see that the price broke above the most recent lower high at 2224 which should
have given the buyers more control. The price is now testing a minor downward
trendline where we can expect the sellers to step in with a defined risk above it
to position for a break below the support with a better risk to reward setup.
The buyers, on the other hand,
will want to see the price breaking higher to increase the bullish bets into a
new cycle high. The red lines define the average daily range for today.
Upcoming
Catalysts
This week is pretty empty on the data front. We begin tomorrow with the release
of the US Flash PMIs. On Thursday, we will get the latest US Jobless Claims
figures. Finally, on Friday we conclude the week with the US PCE report.