Fundamental
Overview
Bitcoin eventually got hit
by the general risk-off sentiment in the markets as the cryptocurrency fell
back to the 64000 level. From a fundamental perspective, nothing has changed as
the data is still pointing to resilient growth, falling inflation and the Fed
cutting at very least two times this year.
As a reminder, Bitcoin rallied
strongly from the lows after a failed attempt to assassinate the former US
President Trump. The market reacted positively to the event because he’s been a
supporter of the crypto industry and Trump’s odds of winning the election
soared.
Moreover, the two main
bearish drivers that we had in the prior weeks have been gone as the German
government finally offloaded all of its Bitcoin holdings on July 12th
and the old crypto exchange Mt. Gox has been repaying its old clients since the
first week of July.
Bitcoin
Technical Analysis – Daily Timeframe
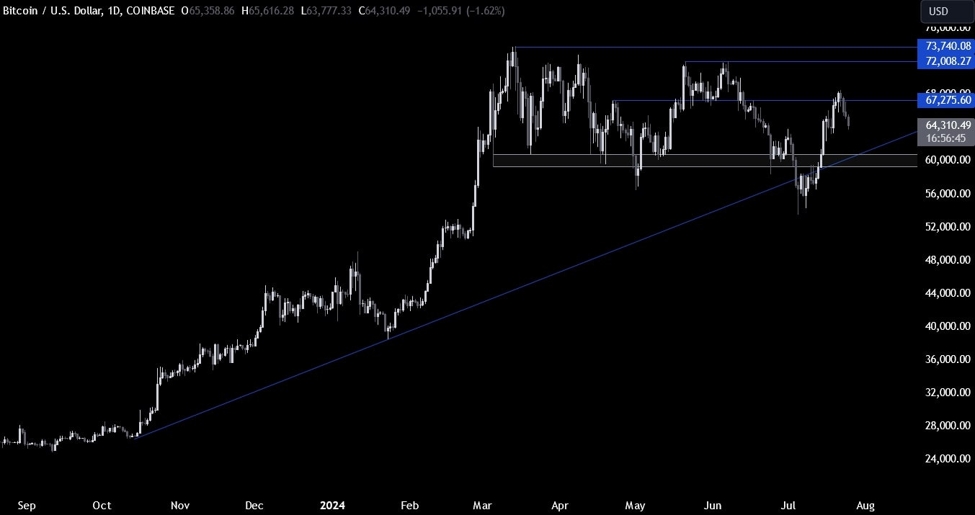
Bitcoin Daily
On the daily chart, we can
see that Bitcoin eventually couldn’t break above the key 67.275 resistance and dropped into the 64000 area. The
natural target for the sellers should be the major trendline
and the support zone around the 60000 level, but they will need to break some
strong levels on the lower timeframes first.
Bitcoin Technical
Analysis – 4 hour Timeframe
Bitcoin 4 hour
On the 4 hour chart, we can
see that we got the pullback into the 64000 support zone where we can find the confluence of the previous swing high, the
minor trendline and the 38.2% Fibonacci retracement level.
This is where we can expect
the buyers to step in with a defined risk below the support zone to position
for a rally into a new cycle high. The sellers, on the other hand, will want to
see the price breaking lower to increase the bearish bets into the 60000 level
next targeting a breakout.
Bitcoin Technical
Analysis – 1 hour Timeframe
Bitcoin 1 hour
On the 1 hour chart, we can
see more clearly the setup at the 64000 support. The buyers will look for a
bounce, while the sellers will want to see a breakout to the downside. The red
lines define the average daily range for today.
Upcoming Catalysts
Today we will get the latest US Jobless Claims figures and the US Q2 Advance
GDP. Tomorrow, we conclude the week with the US PCE report.