Data shows that the sentiment among Bitcoin investors is close to entering extreme greed territory. Here’s what this could imply for the market.
Bitcoin Fear & Greed Index Is Right On Edge Of Extreme Greed
The “Fear & Greed Index” is an indicator created by Alternative that tells us about the general sentiment among the investors in the Bitcoin and wider cryptocurrency market.
This index uses five factors to determine this average sentiment: volatility, trading volume, market cap dominance, social media sentiment, and Google Trends.
The indicator represents this sentiment using a numeric scale from zero to a hundred. All values above 53 reflect the presence of greed in the market, while those under 47 imply fear among the investors. The region between these two territories corresponds to a neutral mentality.
Besides these three core sentiments, there are two special sentiments called extreme greed and extreme fear. The former occurs above 75, while the latter is below 25.
Now, here is what the current value of the Bitcoin Fear & Greed Index looks like:

The index appears to have a value of 74 at the moment | Source: Alternative
As displayed above, the Bitcoin Fear & Greed Index is at 74 right now, meaning that the market sentiment is deep into the greed territory. This is a drastic improvement from just a couple of weeks ago.
The below chart shows how the metric’s value has changed over the past year.
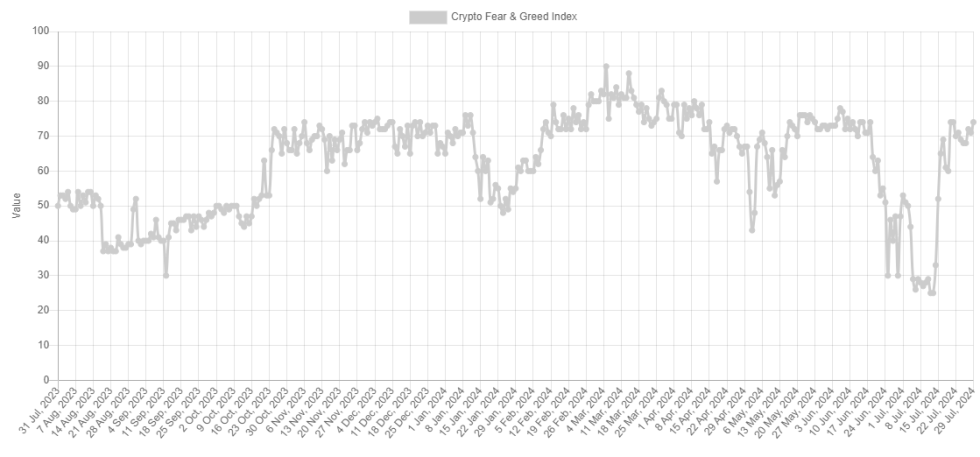
Looks like the value of the metric has seen a sharp rise in recent days | Source: Alternative
As is visible in the graph, the index had plunged to a low of 25 earlier in the month, but since then, the indicator has made a sharp recovery alongside the price rally. Thus, the market has flipped from the verge of entering into extreme fear to standing on the edge of extreme greed inside a short window.
Historically, the Bitcoin price has tended to move in the direction opposite to what the crowd is expecting, and the chances of such a contrary move taking place have usually gone up the stronger this expectation has become.
The extreme regions in the indicator are where this probability is perhaps the strongest, which is why major tops and bottoms in the cryptocurrency’s price have tended to form while the market has been in these zones.
This may also be why Bitcoin could find a bottom when the investor sentiment had neared extreme fear earlier in the month. As BTC is now arriving at the opposite end of the spectrum, it’s possible that a top could be near the asset instead.
Therefore, the Fear & Greed Index could be an indicator to keep an eye on in the coming days, as a venture into extreme greed could be a sign that investors are getting too excited.
BTC Price
At the time of writing, Bitcoin has been floating around $67,700, up almost 2% in the last seven days.
The price of the coin seems to have been going up recently | Source: BTCUSD on TradingView
Featured image from Dall-E, Alternative.me, chart from TradingView.com