Oleksii Liskonih
FRDM strategy
Freedom 100 Emerging Markets ETF (BATS:FRDM) started investing operations on 05/22/2019 and tracks the Freedom 100 Emerging Markets Index. The fund has 119 holdings, a 30-day SEC yield of 2.53% and an expense ratio of 0.49%. Distributions are paid quarterly. As described in the prospectus,
The Index is designed to track the performance of a portfolio of approximately 100 equity securities, which included preferred stocks, in emerging market countries. Country inclusion and weights are determined based on third-party quantified data covering 83 personal and economic freedom variables. Variables can be categorized into three main types of freedom metrics: civil freedom (such as absence of terrorism, human trafficking, torture, disappearances and detainments), political freedom (such as rule of law, due process, freedom of the press, freedom of expression, freedom of religion, and freedom of assembly), and economic freedom (such as marginal tax rates, access to international trade, business regulations, soundness of the money supply, and size of government).
State-owned companies are excluded from the index. Country weights are calculated first based on their Freedom Scores, then companies are weighted based on market capitalization within country weights. The underlying index is reconstituted and rebalanced annually. The portfolio turnover rate was 15% in the most recent fiscal year. This article will use iShares MSCI Emerging Markets ETF (EEM) as a benchmark.
Portfolio
The fund is mostly invested in large and mega cap companies (about 80% of asset value). The heaviest country in the portfolio is Taiwan (27.4% of assets), followed by South Korea (17.6%), Chile (17.4%) and Poland (12.6%). Other countries are below 6%. Compared with the emerging markets benchmark, FRDM excludes China, India, Saudi Arabia and the United Arab Emirates. The weight of Taiwan still represents a large exposure to geopolitical risks related to China.
FRDM country allocation in % of assets (chart: author; data: FRDM, iShares.)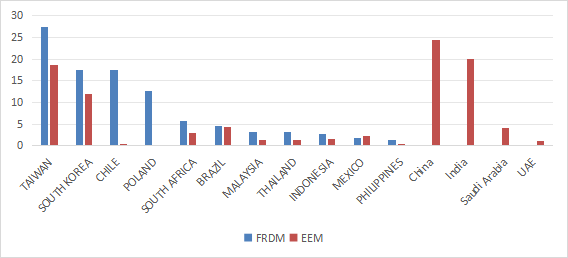
The portfolio is overweight in information technology (34.5%), followed by financials (21.8%). Other sectors are below 9%. Compared to EEM, FRDM significantly overweights technology.
FRDM sector breakdown in % of assets (chart: author; data: FRDM, iShares)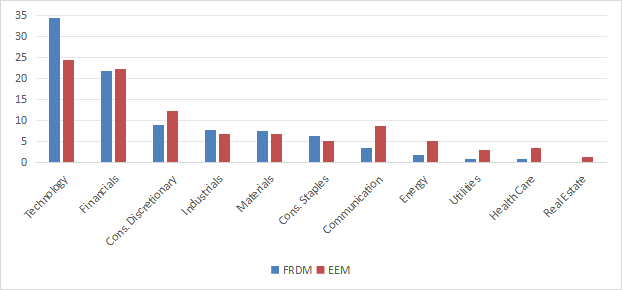
The portfolio is quite concentrated: the top 10 holdings, listed below, represent 43.6% of asset value and the top 3 names weigh between 5% and 10%. Risks related to other individual companies are low to moderate.
|
Ticker |
Name |
Weight% |
|
Taiwan Semiconductor Manufacturing Co Ltd |
10.01 |
|
|
005930 KS |
Samsung Electronics Co Ltd |
7.52 |
|
2317 TT |
Hon Hai Precision Industry Co Ltd |
5.00 |
|
PEO PW |
Bank Polska Kasa Opieki SA |
3.97 |
|
000660 KS |
SK Hynix Inc |
3.42 |
|
2454 TT |
MediaTek Inc |
3.33 |
|
Sociedad Quimica y Minera de Chile S.A. |
3.10 |
|
|
CHILE CI |
Banco de Chile |
2.68 |
|
LTM CI |
Latam Airlines Group SA |
2.53 |
|
FALAB CI |
Falabella SA |
2.08 |
Fundamentals
As reported in the next table, FRDM valuation ratios are not significantly different from the benchmark. Aggregate earnings growth looks great, whereas sales and cash flow growth rates are concerning.
|
FRDM |
EEM |
|
|
Price / Earnings TTM |
14.67 |
14.39 |
|
Price / Book |
1.79 |
1.69 |
|
Price / Sales |
1.31 |
1.49 |
|
Price / Cash Flow |
8.36 |
9.31 |
|
Earnings growth |
24.05% |
17.75% |
|
Sales growth |
-31.84% |
4.97% |
|
Cash flow growth |
-28.15% |
2.36% |
(Data source: Fidelity.)
Performance
FRDM has outperformed EEM by 35% in total return since inception.
FRDM vs EEM since inception (Seeking Alpha)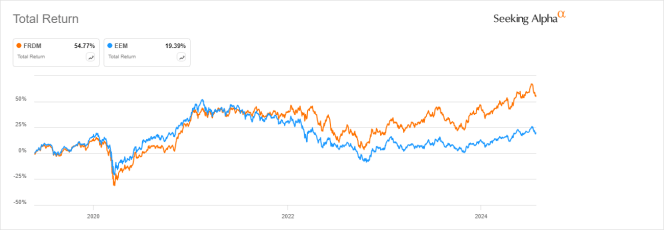
However, FRDM track record is too short to assess its potential relative to EEM on the long term. The two funds are almost on par in 2024 to date.
FRDM vs EEM, year-to-date (Seeking Alpha)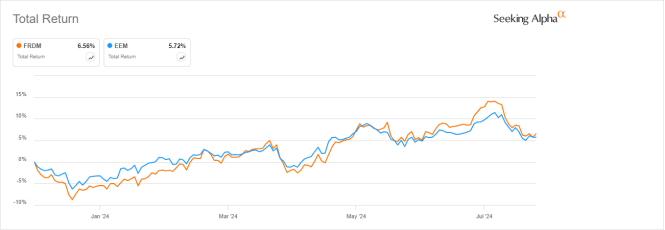
FRDM vs. competitors
The next table compares characteristics of FRDM and three ex-China emerging markets ETFs:
- iShares MSCI Emerging Markets ex China ETF (EMXC),
- KraneShares MSCI Emerging Markets ex China Index ETF (KEMX)
- Columbia EM Core ex-China ETF (XCEM).
|
FRDM |
EMXC |
KEMX |
XCEM |
|
|
Inception |
5/22/2019 |
7/18/2017 |
4/12/2019 |
9/1/2015 |
|
Expense Ratio |
0.49% |
0.25% |
0.24% |
0.16% |
|
AUM |
$795.63M |
$14.31B |
$75.74M |
$1.12B |
|
Avg Daily Volume |
$3.58M |
$111.79M |
$479.99K |
$5.30M |
|
Holdings |
119 |
1158 |
303 |
340 |
|
Top 10 |
43.64% |
27.28% |
28.81% |
29.75% |
|
Turnover |
15.00% |
13.00% |
50.00% |
19.00% |
FRDM has the highest expense ratio and is the most concentrated of these funds. The next chart compares total returns since inception. FRDM is leading the pack by a short margin.
FRDM vs. Ex-China EM ETFs, since inception (Seeking Alpha)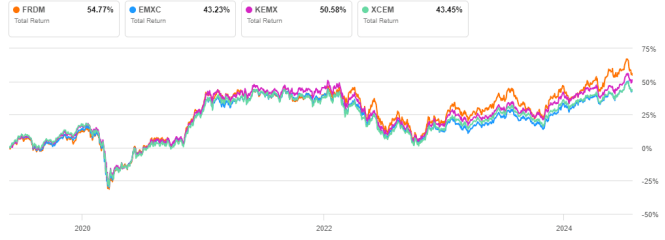
Takeaway
Freedom 100 Emerging Markets ETF invests in about 100 companies from emerging countries selected and weighted based on a Freedom Score. Not only China, but also India, Saudi Arabia and the United Arab Emirates are excluded. Though, the heavy weight of Taiwan still represents a large exposure to geopolitical risks related to China. The portfolio is quite concentrated in technology and in its top holdings. Since inception, FRDM has outperformed the emerging markets benchmark and ex-China EM ETFs. Although the Freedom 100 Emerging Markets ETF strategy makes a lot of sense, investors willing to reduce geopolitical risk (and Taiwan exposure) may prefer to build a personalized portfolio of selected country ETFs.
Editor’s Note: This article discusses one or more securities that do not trade on a major U.S. exchange. Please be aware of the risks associated with these stocks.