Fundamental
Overview
The USD has been rallying
steadily against most major currencies in the recent couple of weeks, although
the catalyst behind the move has been unclear. A good argument has been that
most of the moves we’ve been seeing were driven by deleveraging from
strengthening Yen.
Basically, the squeeze on
the carry trades impacted all the other markets. Given the magnitude of the
recent appreciation in the Yen and the correlation with many other markets, it
looks like this could have been the reason indeed. It will be interesting to
see how things evolve in the next days now that the BoJ decision is in the rear-view
mirror and if this correlation fades.
From the monetary policy
perspective, nothing has changed as the market continues to expect at least two
rate cuts by the end of the year and sees some chances of a back-to-back cut in
November. Today, we will also have the FOMC rate decision where the Fed is
expected to keep rates steady and signal a rate cut in September.
The data continues to
suggest that the US economy remains resilient with inflation slowly falling
back to target. Overall, this should continue to support the soft-landing
narrative and be positive for the general risk sentiment.
The GBP, on the other hand,
has been supported against the US Dollar in the past months mainly because of
the risk-on sentiment, although the recent events with the Yen boosted the US
Dollar against many major currencies.
On the monetary policy
front, the market is assigning a 60% probability of a rate cut from the BoE
tomorrow although the recent data was a disappointment for the central bank as
the UK CPI figures were unchanged from the prior month
and the labour market report showed wage growth remaining
at elevated levels.
GBPUSD
Technical Analysis – Daily Timeframe
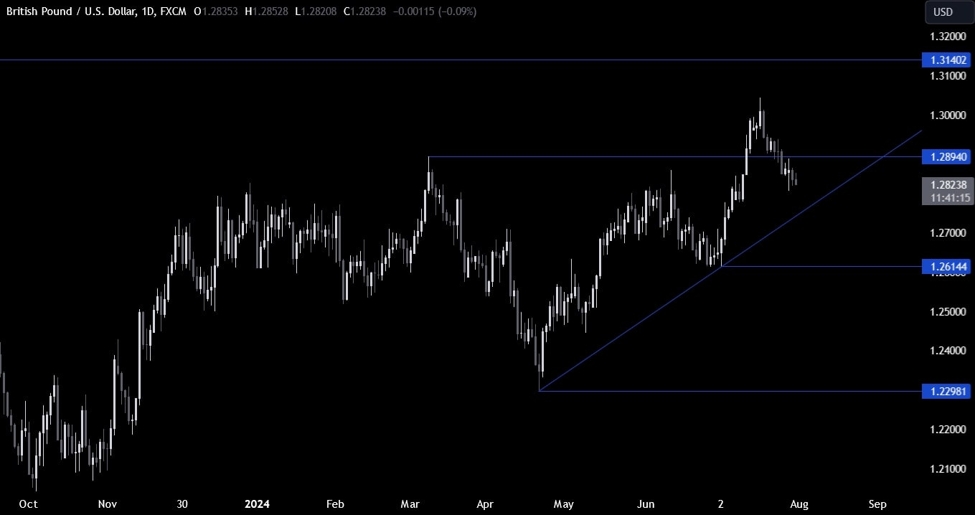
GBPUSD Daily
On the daily chart, we can
see that GBPUSD dropped below the key 1.29 handle and extended the losses as
the sellers piled in with more conviction. The natural target should be the major
trendline around the 1.2780 level where we
can expect the buyers to step in with a defined risk below the trendline to
position for a rally into a new cycle high.
GBPUSD Technical
Analysis – 4 hour Timeframe
GBPUSD 4 hour
On the 4 hour chart, we can
see that we have a minor downward trendline defining the current bearish
momentum. The sellers will likely keep on leaning on it to position for further
downside, while the buyers will want to see the price breaking above the trendline
and the 1.29 handle to pile in for new highs.
GBPUSD Technical
Analysis – 1 hour Timeframe
GBPUSD 1 hour
On the 1 hour chart, we can
see more clearly the recent price action with the trendline acting as
resistance. A breakout to the upside should give the buyers more confidence for
a rally into new highs, but a break above the 1.29 level would give much more
conviction. The red lines define the average daily range for today.
Upcoming
Catalysts
Today we have the US ADP, the US Employment Cost Index and the FOMC Policy
Decision. Tomorrow, we have the BoE Policy Decision, the latest US Jobless Claims figures and the US ISM
Manufacturing PMI. Finally, on Friday, we conclude the week with the US NFP
report.