Fundamental
Overview
The S&P 500 has been on a steady decline since the last US CPI report
on July 11th. In the first stages of the pullback, we’ve been seeing
a rotation from big cap stocks into small cap stocks as the Russell 2000
displayed an opposite price action. Eventually, the bearish momentum picked up
and we saw a more aggressive decline with the index falling by 5%.
A good argument
has been that most of the moves we’ve been seeing were driven by deleveraging
from strengthening Yen. Basically, the squeeze on the carry trades
impacted all the other markets. Given the magnitude of the recent appreciation
in the Yen and the correlation with many other markets, it looks like this
could have been the reason indeed.
It will be interesting to
see how things evolve in the next days and if this correlation finally fades
now that the BoJ decision is in the rear-view mirror. It’s already a good sign that despite some more yen strengthening this morning, the stock market held the gains. From a
big picture perspective, nothing has changed as the market continues to expect
at least two rate cuts by the end of the year and sees some chances of a
back-to-back cut in November.
Today, we will also have
the FOMC rate decision where the Fed is expected to keep rates steady and
signal a rate cut in September. Overall, this should continue to support the
soft-landing narrative and be positive for the general risk sentiment as the
Fed is going to cut rates into resilient growth.
S&P 500
Technical Analysis – Daily Timeframe
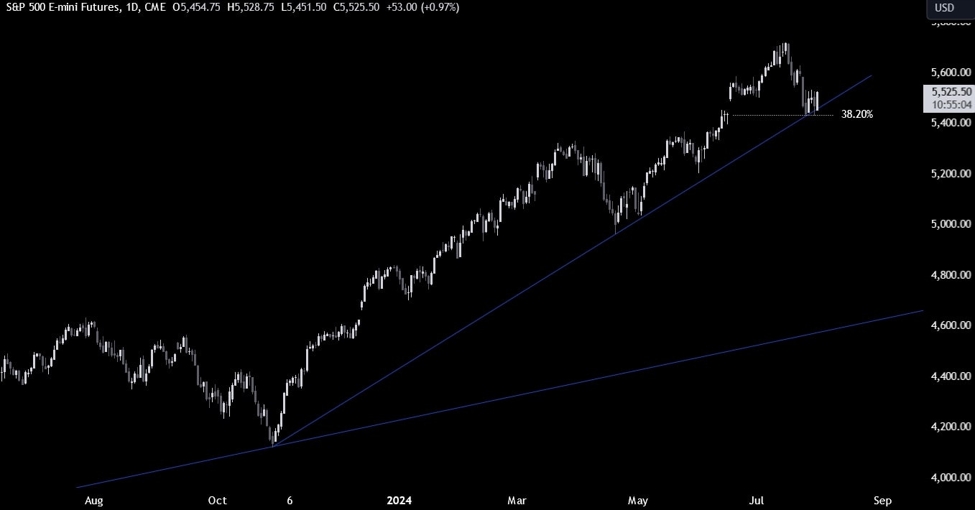
S&P 500 Daily
On the daily chart, we can
see that the S&P 500 seems to be bottoming out at the major trendline around the 5435 level where we had
also the 38.2% Fibonacci retracement level for confluence. The buyers stepped with a defined
risk below the recent lows to position for a rally into a new all-time high.
The sellers will need the price to break below the trendline and the 5430 level
to increase the bearish bets into new lows.
S&P 500 Technical
Analysis – 4 hour Timeframe
S&P 500 4 hour
On the 4 hour chart, we can
see that we have a strong resistance zone around the 5540 level where we
can find the confluence of the previous swing low, the downward trendline and
the 50% Fibonacci retracement level. This is where we can expect the sellers to
step in with a defined risk above the resistance to position for a drop into
new lows. The buyers, on the other hand, will want to see the price breaking
higher to invalidate the bearish setup and increase the bullish bets into a new
all-time high.
S&P 500 Technical
Analysis – 1 hour Timeframe
S&P 500 1 hour
On the 1 hour chart, we can
see that we’ve been consolidating between the 5440 support and the 5540
resistance. The market participants might keep on playing the range for now,
but a breakout on either side should lead to a strong and sustained move. The
red lines define the average daily range for today.
Upcoming
Catalysts
Today we have the US ADP, the US Employment Cost Index and the FOMC Policy
Decision. Tomorrow, we get the latest US Jobless Claims figures and the US ISM
Manufacturing PMI. Finally, on Friday, we conclude the week with the US NFP
report.