EXTREME-PHOTOGRAPHER
The earnings of BCB Bancorp, Inc. (NASDAQ:BCBP) will most probably start recovering soon because interest rate cuts will lift the net interest margin. Moreover, the loan portfolio’s downtrend will likely reverse soon, which will support the bottom line. Overall, I’m expecting the company to report earnings of $1.22 per share for 2024, down 28% year-over-year, and $1.68 per share for 2025, up 38% year-over-year. The December 2024 target price suggests a high upside from the current market price. Additionally, BCB Bancorp is offering an attractive dividend yield of 5.6%. Based on the total expected return, I’m maintaining a buy rating on BCB Bancorp.
Falling Interest Rates to Lift the Margin
The net interest margin finally grew by 10 basis points in the second quarter of the year after declining for six consecutive quarters. The margin’s improvement was partly attributable to a decline in the balances of costly Certificates of Deposits (“CD”).
2Q 2024 10-Q Filing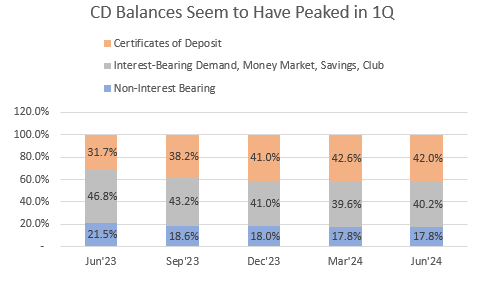
The yield on CDs is quite high relative to other deposit accounts; therefore, the small change in CD balances had a magnified impact on the average deposit cost, and consequently the margin.
SEC Filings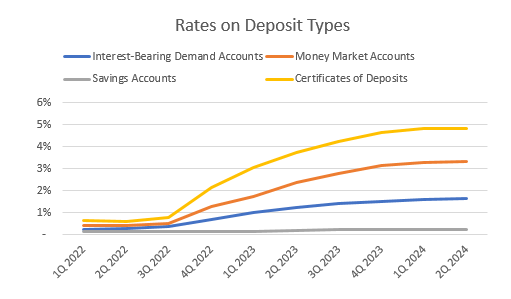
Most of BCB Bancorp’s CDs mature within a year. The 10-K filing for last year’s results disclosed that around 98% of the CD portfolio was scheduled to mature in the next twelve months, i.e. by the end of 2024. Moreover, BCB Bank’s website, shows that it is currently offering only 7-month CDs. Therefore, a large portion of the CD book can be expected to mature in upcoming quarters, which will lead to further easing of pressure on the margin.
The management mentioned in the second quarter’s 10-Q filing that BCB Bancorp’s assets, consisting primarily of mortgage loans, have longer maturities than the liabilities, consisting primarily of deposits. Therefore, a falling interest-rate environment will benefit the net interest margin.
I’m expecting the Fed funds rate to dip by 25 basis points in the last quarter of 2024 and by 100 basis points in 2025. Considering these factors, I’m expecting the net interest margin to increase by four basis points in the second half of 2024 and eight basis points in 2025.
End to Loan Decline in Sight
The loan portfolio dipped by 2.0% during the second quarter, which was the fourth straight quarter of decline. The loan portfolio has dipped by 3.5% during the first half of the year, or 7.0% annualized, compared to the last five-year compounded annual growth rate of (positive) 7.6%. However, for historical comparison please keep in mind that growth has been quite volatile in the past, with a high of 32% (achieved in 2022) and a low of negative 4.4% (2019).
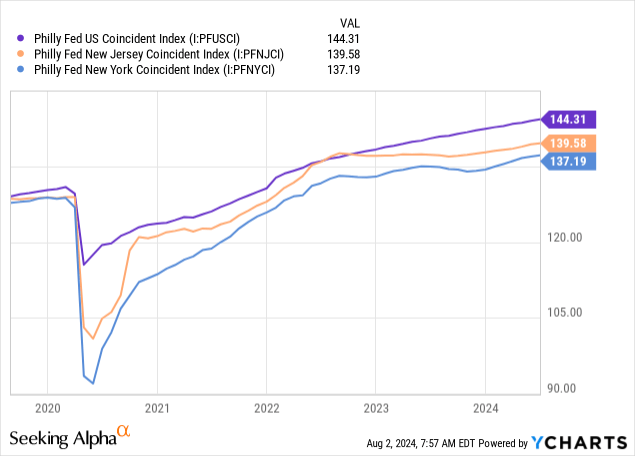
I’m optimistic that the declining loan trend will end soon because of the regional economy. BCB Bancorp mostly focuses on commercial real estate and multifamily loans, which make up around 73% of total loans. Further, the company mostly operates in the states of New Jersey and New York. As a result, the economic condition of these two states plays a key role in driving loan growth. After faltering in late 2023, the economic activity of these two states (as depicted by the coincident index) is fast improving. See the chart below and compare the slopes of the New Jersey and New York coincident indices with the slope of the U.S. index.
As a result, I’m expecting the loan portfolio to grow by 1% every quarter through the end of 2025. Further, I’m expecting other balance sheet items to grow in tandem with loans. The following table shows my balance sheet estimates.
| Financial Position | FY19 | FY20 | FY21 | FY22 | FY23 | FY24E | FY25E |
| Net Loans | 2,178 | 2,228 | 2,305 | 3,045 | 3,280 | 3,225 | 3,356 |
| Growth of Net Loans | (4.4)% | 2.3% | 3.5% | 32.1% | 7.7% | (1.7)% | 4.1% |
| Other Earning Assets | 621 | 360 | 514 | 329 | 362 | 456 | 474 |
| Deposits | 2,362 | 2,318 | 2,561 | 2,812 | 2,979 | 2,994 | 3,116 |
| Borrowings and Sub-Debt | 296 | 243 | 122 | 434 | 524 | 535 | 557 |
| Common equity | 214 | 223 | 245 | 270 | 289 | 300 | 317 |
| Book Value Per Share ($) | 13.1 | 13.1 | 14.2 | 15.6 | 17.1 | 17.6 | 18.7 |
| Tangible BVPS ($) | 12.7 | 12.7 | 13.9 | 15.3 | 16.8 | 17.3 | 18.4 |
| Source: SEC Filings, Earnings Releases, Author’s Estimates (In USD million unless otherwise specified) | |||||||
Earnings Likely to Recover Next Year
After falling in the first half of this year, earnings will likely recover soon. Both the anticipated margin expansion and loan growth will lift earnings in upcoming quarters. Further, I’m making the following assumptions to derive my earnings estimate for 2024 and 2025.
- BCB reported an unusually large loss of $4.6 million on the sale of loans in the second quarter. I’m not expecting it to recur in upcoming quarters. As a result, I’m expecting non-interest income to return to a normal level.
- After remaining unusually high in the first half of 2024, I’m expecting the provision expense for loan losses to return to the 2023 level of 0.19% of loans.
- The efficiency ratio (calculated as non-interest expense divided by total revenue) jumped to 68.5% in the second quarter. I’m expecting the efficiency ratio to gradually revert to the last five-year average of 55.3%.
Overall, I’m expecting the company to report earnings of $1.22 per share for 2024, down 28% year-over-year. For 2025, I’m expecting BCB Bancorp to report earnings of $1.68 per share, up 38% year-over-year. The following table shows my income statement estimates.
| Income Statement | FY19 | FY20 | FY21 | FY22 | FY23 | FY24E | FY25E |
| Net interest income | 83 | 80 | 97 | 114 | 104 | 95 | 101 |
| Provision for loan losses | 2 | 9 | 4 | (3) | 6 | 8 | 6 |
| Non-interest income | 5 | 12 | 9 | 2 | 4 | 2 | 7 |
| Non-interest expense | 56 | 54 | 54 | 56 | 61 | 57 | 59 |
| Net income – Common Sh. | 20 | 20 | 33 | 45 | 29 | 21 | 29 |
| EPS – Diluted ($) | 1.20 | 1.14 | 1.92 | 2.58 | 1.70 | 1.22 | 1.68 |
| Source: SEC Filings, Earnings Releases, Author’s Estimates(In USD million unless otherwise specified) | |||||||
Loan Book Drives Overall Riskiness
Due to BCBP’s focus on commercial real estate loans, the exposure to office building loans is a major source of risk. Unfortunately, the company has not disclosed the amount of loans backed by office buildings. However, it did disclose in the 10-K filing that it offers CRE loans at loan amounts up to 75 percent of the appraised value of the property, which I think is quite a high LTV ratio.
Moreover, the asset quality of the loan book is fast deteriorating. Non-accrual loans rose to 1.01% of total loans by the end of June 2024 from 0.57% at the end of December 2023 and 0.17% at the end of June 2023, as mentioned in the earnings release.
Fortunately, the securities portfolio doesn’t carry as much risk. The unrealized mark-to-market losses on the Available-for-Sale securities portfolio amounted to $9.9 million, which is just 3% of the equity book value.
Overall, I think BCB Bancorp’s risk level is moderate.
BCBP is Offering an Attractive Dividend Yield
BCB Bancorp has maintained its quarterly dividend at $0.16 per share since the second quarter of 2021. This dividend level and the August 2 closing price give a dividend yield of 5.6%. The dividend payout appears secure because my earnings estimate suggests a payout ratio of 52.6%, which is easily sustainable, even though it’s higher than the last five-year average of 38%.
Moreover, the company’s capital is at a comfortable level, which reduces the threat of a dividend cut to meet regulatory requirements. BCB Bancorp reported a total capital (to risk-weighted assets) ratio of 11.77%, which is higher than the minimum regulatory requirement of 10.0%. The excess capital comes out to $58 million. To put this number in perspective, the annual dividend payout comes out to $11 million. So there is plenty of room to pay the dividend even if the earnings went down to zero.
Adopting a Buy Rating
I’m using the historical price-to-tangible book (“P/TB”) and price-to-earnings (“P/E”) multiples to value BCB Bancorp. The stock has traded at an average P/TB ratio of 0.95 in the past, as shown below.
| FY19 | FY20 | FY21 | FY22 | FY23 | Average | |
| T. Book Value per Share ($) | 12.7 | 12.7 | 13.9 | 15.3 | 16.8 | |
| Average Market Price ($) | 12.7 | 10.0 | 14.2 | 18.3 | 12.8 | |
| Historical P/TB | 1.00x | 0.79x | 1.02x | 1.20x | 0.76x | 0.95x |
| Source: Company Financials, Yahoo Finance, Author’s Estimates | ||||||
Multiplying the average P/TB multiple with the forecast tangible book value per share of $17.3 gives a target price of $16.5 for the end of 2024. This price target implies a 43.2% upside from the August 2 closing price. The following table shows the sensitivity of the target price to the P/TB ratio.
| P/TB Multiple | 0.75x | 0.85x | 0.95x | 1.05x | 1.15x |
| TBVPS – Dec 2024 ($) | 17.3 | 17.3 | 17.3 | 17.3 | 17.3 |
| Target Price ($) | 13.0 | 14.8 | 16.5 | 18.2 | 20.0 |
| Market Price ($) | 11.5 | 11.5 | 11.5 | 11.5 | 11.5 |
| Upside/(Downside) | 13.2% | 28.2% | 43.2% | 58.2% | 73.3% |
| Source: Author’s Estimates |
The stock has traded at an average P/E ratio of around 8.3x in the past, as shown below.
| FY19 | FY20 | FY21 | FY22 | FY23 | Average | |
| Earnings per Share ($) | 1.20 | 1.14 | 1.92 | 2.58 | 1.70 | |
| Average Market Price ($) | 12.7 | 10.0 | 14.2 | 18.3 | 12.8 | |
| Historical P/E | 10.6x | 8.8x | 7.4x | 7.1x | 7.5x | 8.3x |
| Source: Company Financials, Yahoo Finance, Author’s Estimates | ||||||
Multiplying the average P/E multiple with the forecast earnings per share of $1.22 gives a target price of $10.1 for the end of 2024. This price target implies a 12.6% downside from the August 2 closing price. The following table shows the sensitivity of the target price to the P/E ratio.
| P/E Multiple | 6.3x | 7.3x | 8.3x | 9.3x | 10.3x |
| EPS 2024 ($) | 1.22 | 1.22 | 1.22 | 1.22 | 1.22 |
| Target Price ($) | 7.6 | 8.9 | 10.1 | 11.3 | 12.5 |
| Market Price ($) | 11.5 | 11.5 | 11.5 | 11.5 | 11.5 |
| Upside/(Downside) | (33.7)% | (23.1)% | (12.6)% | (2.0)% | 8.5% |
| Source: Author’s Estimates |
Equally weighting the target prices from the two valuation methods gives a combined target price of $13.3, which implies a 15.3% upside from the current market price. Adding the forward dividend yield gives a total expected return of 20.9%.
In my last report, which was issued back in July 2023, I adopted a buy rating. Based on my updated total expected return, I’ve decided to maintain the buy rating on BCB Bancorp.