
Bitcoin is falling. Earlier today, the coin crashed to as low as $49,000, a 30% dip from July highs. Even though the coin has briefly retraced, peeling off some losses, the downtrend remains, at least from the candlestick formation in the daily chart. The sharp sell-off of Bitcoin is weighing on the altcoin and crypto markets. At press time, the total crypto market cap, according to CoinMarketCap, is down 15.46% to roughly $1.82 trillion.
Bitcoin At A Precarious Level: Bears Might Force Prices To $40,000
Although the uptrend remains from a top-down preview, one analyst thinks there will be more blood in the coming days if sellers press on.
Taking to X and citing on-chain developments, the analyst noted that since the coin recently dipped 12% lower than the on-chain trader realized price, Bitcoin finds itself at a crucial level. In the past, prices bounced back, snapping back to the primary uptrend when BTC prices retested this line.
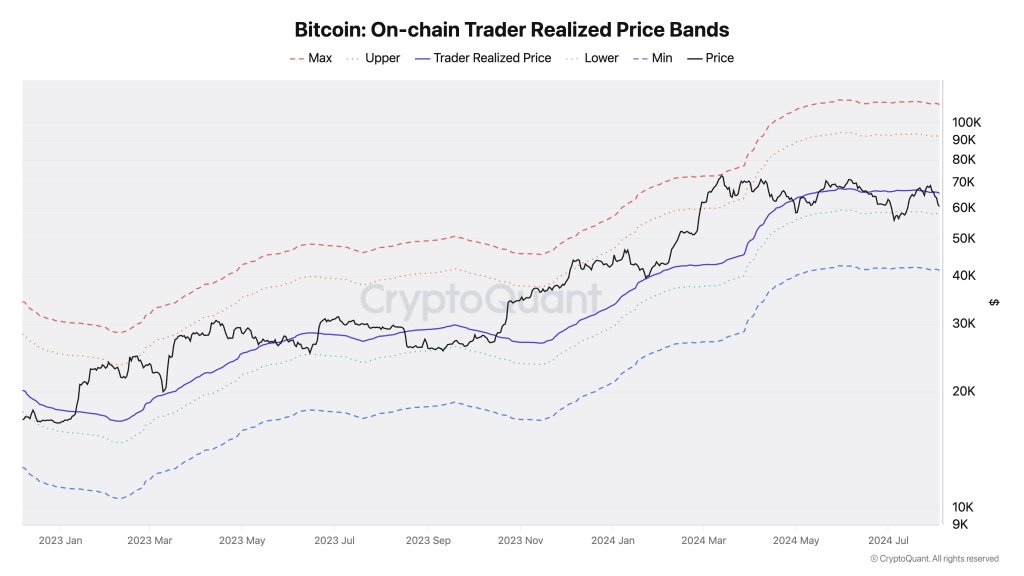
The on-chain trader realized price is a metric used to indicate the average price at which the current cohort of BTC holders bought their coins. Currently, BTC is way lower than the realized price, meaning holders are in red and possibly contemplating selling to manage risk.
If BTC extends today’s losses, the probability of holders exiting for stablecoins or fiat will be higher, accelerating the sell-off. According to the on-chain analyst, Bitcoin may plunge towards the $40,000 level if sellers aggressively press on.
Time For Institutions To Buy At A Discount?
From the daily chart, bears have reversed all gains posted from July 8 to 21, pushing prices below the July 2024 lows. Pasting a Fibonacci retracement tool on the October 2023 to March 2024 swing high and low, it is clear that BTC has retested the 50% Fibonacci level.
Meanwhile, the August 5 bar is wide-ranging and marked with high trading volume, meaning the sell-off is supported. Since the coin is within a bear breakout formation, the odds of BTC slipping toward the 78.6% Fibonacci level or to as low as $35,000 remains highly probable.
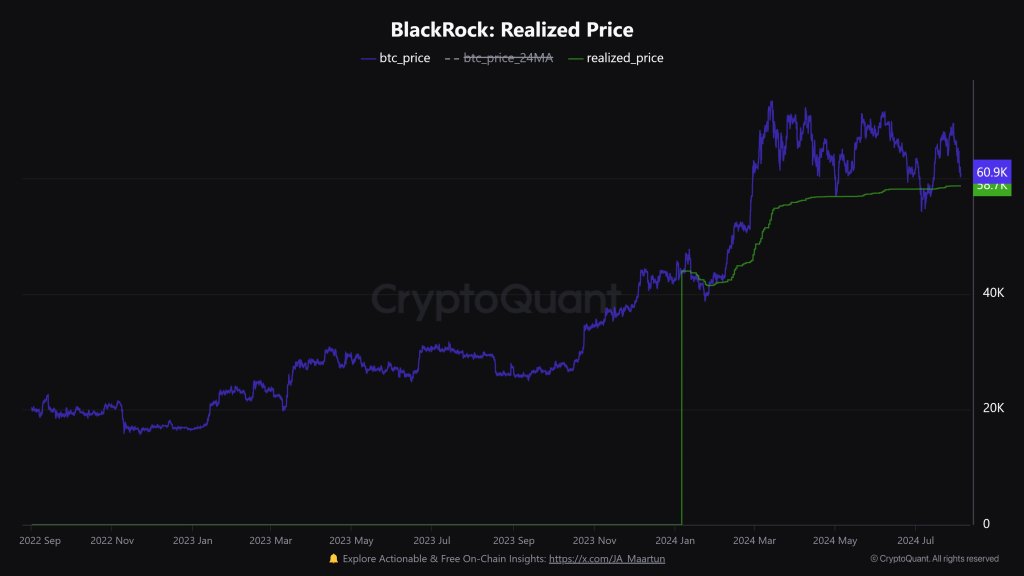
However, if BTC finds support this week, bulls could be emboldened, helping the recovery. It would be a welcomed development now that when prices crashed today, BTC fell below the average cost basis of the BlackRock spot Bitcoin ETF, which stands at around $58,700.
As long as prices remain at or below this zone, institutional investors might double down, buying more at a lower price through BlackRock.
Feature image from Canva, chart from TradingView