Fundamental
Overview
The Russell 2000 has been on an incredible run ever since the last US CPI report. The goldilocks
data was the catalyst for a strong rotation from big cap stocks into the small
cap stocks, and the momentum was probably exacerbated by hedge funds facing
short squeezes on their small cap hedges as yields came down.
The market hasn’t even suffered the selloff in the major indices caused by
the deleveraging of Yen carry trades and continued to trade around the highs. Unfortunately,
that has changed last week as we got two important US data points surprising to
the downside.
The first wave of selling was triggered by the ugly US
ISM Manufacturing PMI and then the selloff exacerbated following the weak US
NFP report. Eventually, we got a global stock market rout on Monday as the
Japanese Nikkei crashed 12% in a single day.
At the peak of the risk
aversion the markets saw the Fed cutting rates by 136 bps by year-end and some
chances of an emergency rate cut. Although the volatility calmed down a bit,
the markets are still expecting a 50 bps cut by the Fed in September and a
total of 103 bps by year-end.
The US Jobless Claims
figures tomorrow will likely be key as good data should quell the fears around
the labour market, while bad figures could scare the market again.
Russell 2000
Technical Analysis – Daily Timeframe
Russell 2000 Daily
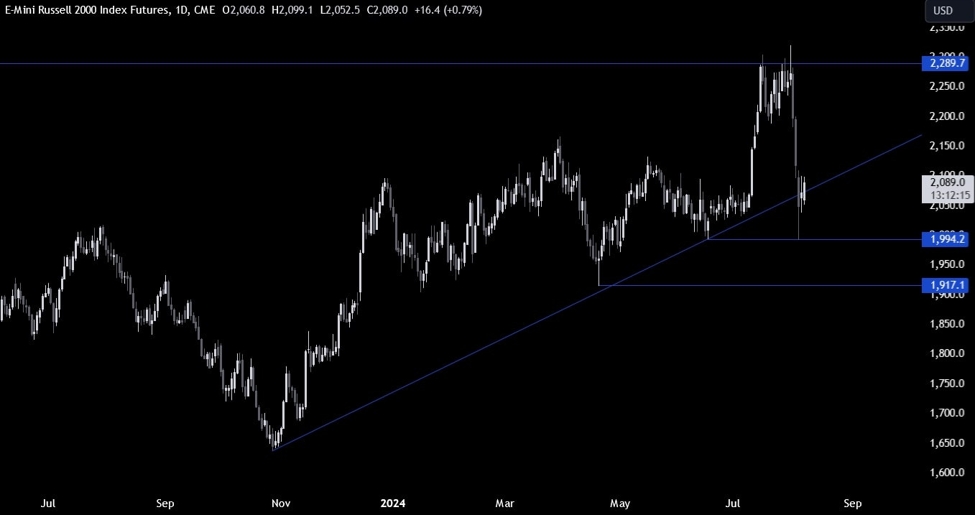
On the daily chart, we can
see that the Russell 2000 couldn’t break above the 2290 resistance and eventually sold off all the way
down to the 1994 level on weak US data and global market rout. The price broke through
the major trendline on Monday but has recovered all the
losses since then.
The buyers might start to
pile in above the trendline with a defined risk below it, while the sellers
will look for another drop below the trendline to increase the bearish bets
into new lows.
Russell 2000 Technical
Analysis – 4 hour Timeframe
Russell 2000 4 hour
On the 4 hour chart, we can
see that we have a strong resistance around the 2100 level where the price got
rejected from several times in the past couple of days. A breakout to the
upside should see the buyers gaining more confidence and increasing the bullish
bets into new highs. The sellers, on the other hand, will likely lean on this
resistance with a defined risk above it to position for a drop back into the
1994 level.
Russell 2000 Technical
Analysis – 1 hour Timeframe
Russell 2000 1 hour
On the 1 hour chart, we can
see the recent catalysts marked on the chart with the first wave of selling
triggered by the ISM Manufacturing PMI and then exacerbated by the weak NFP
report. The US Jobless Claims figures tomorrow will likely be key as good data
should quell the fears around the labour market, while bad figures could scare
the market again. The red lines define the average daily range for today.
Upcoming
Catalysts
This week is basically empty on the data front. The only notable economic release
will be on Thursday when we get the latest US Jobless Claims figures. The
market will also pay close attention to Fed members’ comments given the latest
developments in the markets.