baona
Investment Thesis
At the end of 2019, Weatherford International plc (NASDAQ:WFRD) emerged from its Chapter 11 re-organization. Post-2020, its performance has improved with better contribution margin, asset turnover, and leverage leading to better returns.
But this is a cyclical company with a 77% correlation between its revenue and crude oil prices. The current performance is probably due to the better crude oil prices. Over the crude oil price cycle, I would expect the performance to be lower than the current one. Even ignoring the cyclical performance, there is no margin of safety. I do not see this as an investment opportunity for the long-term investor.
Background
The present form of Weatherford followed from the 2019 bankruptcy (Chapter 11 in the US) re-organization. This is an oilfield services company providing a range of services required for the exploration, extraction, and production of oil and natural gas.
Weatherford currently has 3 reporting segments – Drilling & Evaluation, Well Construction & Completions, and Production & Intervention.
I do not see the segment reporting as critical because they all fall within the oilfield services/equipment sector when looking at the Beta (as per the Damodaran dataset).
Besides, over the past decade, there have been frequent changes to the segment reporting as exemplified by the following:
- In 2014, there were 2 segments – Formation Evaluation & Well Construction, and Completion & Production.
- In 2018, there were 4 segments – Production, Completions, Drilling & Evaluation, and Well Construction.
- In 2022, there were 3 segments – Drilling & Evaluation, Well Construction & Completions, and Production & Intervention
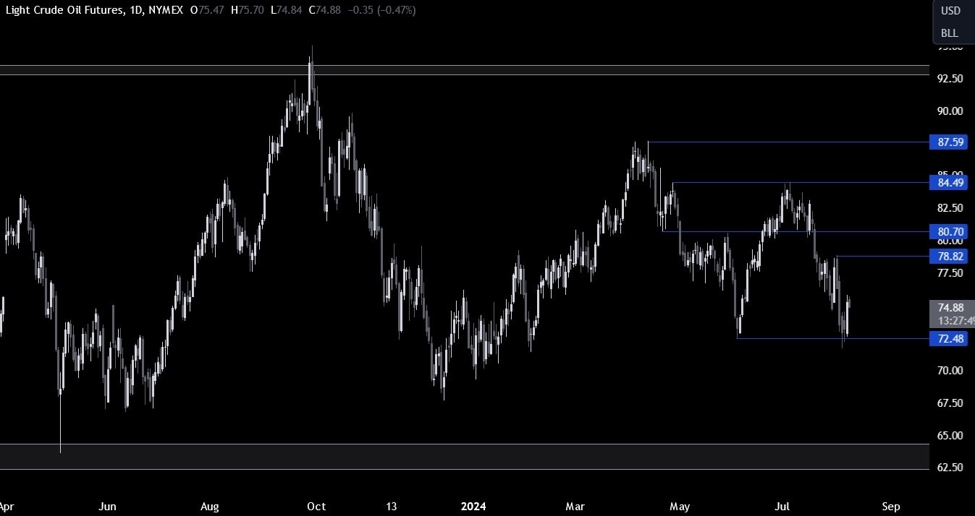
As an oilfield services company, Weatherford’s fortune is tied to the expenditure of the oil & gas companies. This in turn is tied to crude oil prices. Crude oil prices are cyclical, as illustrated in the left part of Chart 1.
You can see from the right part of Chart 1 that Weatherford’s revenue over the past 20 years shares the same pattern as that for crude oil prices. There is a 77% correlation between Weatherford revenue and Brent crude oil prices over the past 2 decades.
Chart 1: Crude Oil Price and Weatherford Revenue vs Brent Oil Price Source (Author based on Statista)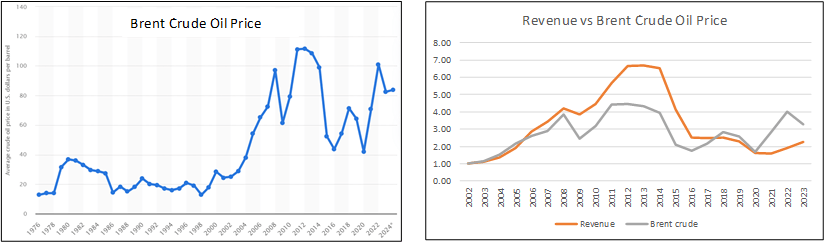
Note on the right part of Chart 1: To be able to plot the revenue and crude oil price onto one chart, I converted them into indices by dividing the values for each year by the respective 2002 values.
Operating trends
From a high-level perspective, Weatherford is not a wonderful company in the Buffett sense. Refer to Chart 2.
- While revenue has been trending up since 2020, there was hardly any revenue growth from 2015 to 2023. If you look at Chart 1, you can see that 2015 was at the bottom of the crude oil price cycle, whereas the price in 2023 was about 2/3 higher than that in 2015. We have a higher oil price in 2023, but a lower revenue. This discrepancy is clearly seen in the right part of Chart 1.
- While PAT showed an uptrend from 2015, this came from many years of losses. Furthermore, the profit in 2019 was due to “a gain on extinguishment of debt of $4.3 billion” following the bankruptcy re-organization.
- Capital efficiency as measured by gross profitability seemed to be trending down post-2020. The level in 2023 was even lower than that in 2015.
Chart 2: Performance Index and Returns (Author)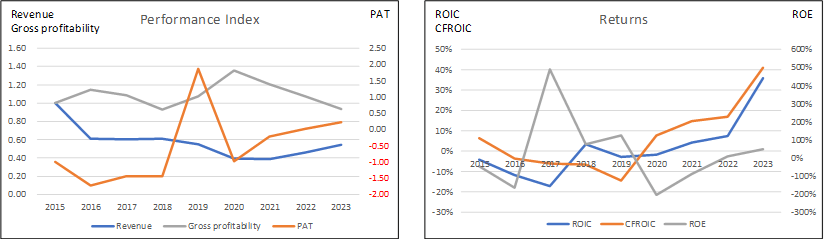
Note to Chart 2: Weatherford undertook several divestments in 2014 amounting to USD 1.7 billion. As such, it was more appropriate to trace the history from 2015.
However, post-2020, the returns have been trending up with the 2022 and 2023 returns being higher than those in 2015. Refer to the right part of Chart 2.
The question is whether the improvements were due to high crude oil prices or improvements in the operations. To get some insights into this, I looked at the contribution margin as well as the DuPont metrics. Refer to Chart 3.
- The improvement in the contribution margin started in 2017.
- There were uptrends in the leverage and asset turnover from 2015 notwithstanding the 2019 dip.
- Selling, General, and Administration (SG&A) margins were 16% in 2023 compared to 17% in 2015. This was despite lower revenue in 2023.
Looking at the results above, I would say that Weatherford probably benefited from the higher crude oil prices. But not all improvements were externally driven, as exemplified by the better leverage, asset turnover, and SGA margin which started before the 2019 re-organization.
Chart 3: Operating Profit and DuPont Analysis (Author)
Note to Op Profit Profile. I broke down the operating profits into fixed costs and variable costs.
- Fixed cost = SGA, Depreciation & Amortization and Others.
- Variable cost = Cost of Sales – Depreciation & Amortization.
- Contribution = Revenue – Variable Cost.
- Contribution margin = Contribution/Revenue.
Peer comparison
In its Form 10k, Weatherford listed several competitors. I managed to find data for the following – Schlumberger (SLB), Halliburton (HAL), Baker Hughes (BKR), ChampionX (CHX) and Expro Group Holdings (XPRO).
I looked at 2 metrics – return on capital and EBIT margin to compare Weatherford’s performance with its competitors. Refer to Chart 4.
Before the 2019 re-organization, Weatherford’s return on capital and EBIT margin were among the panel’s worst. But over the past 2 years, Weatherford performance seems to be rising to the top.
Chart 4: Peer comparison (Author)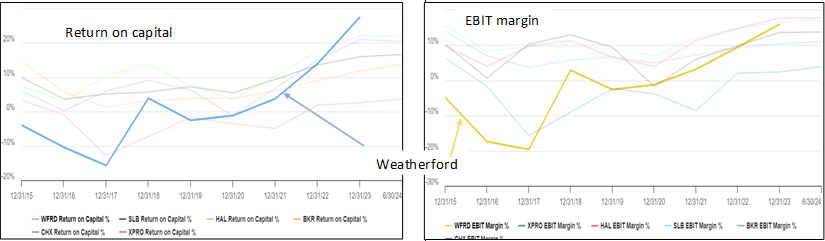
Financial position
Weatherford’s financial position does not look too good. While it had some positive points, I think they are not good enough to offset the negative ones:
The positive points included the following:
- It had USD 862 million in cash and short-term investments as of the end of March 2024. This was about 7% of its total assets.
- It has a negative Reinvestment from 2015 to 2023. I defined Reinvestment = CAPEX + Acquisition – Divestiture – Depreciation & Amortization + Changes in Net Working Capital. The negative Reinvestment was because the Depreciation & Amortization, and Divestiture in certain years far exceeded what was spent on CAPEX + Acquisition and Net Working Capital.
My main concern is with its debt position and cash flow generation track record:
As of Jun 2024, it had a debt-capital ratio of 60%. While this had come down from its 2018 high of 185%, it is much higher than the sector average. According to the Damodaran Jan 2024 dataset, the debt-capital ratio for the oilfield services/equipment sector was 24%.
Over the past 9 years, it generated positive cash flow from operations for 5 years. From 2015 to 2023, it generated USD 808 million in cash flow from operations, despite having a cumulative loss after tax. Unfortunately, the cash flow from operations was not enough to cover the Net CAPEX. Refer to Table 1.
Table 1: Sources and Uses of Funds 2015 to 2023. (Author)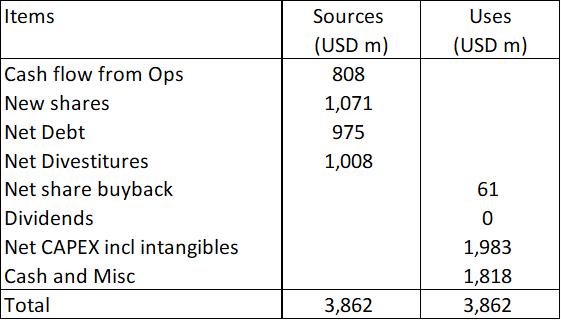
Valuation
Weatherford is a cyclical company with a strong correlation with crude oil prices. The appropriate thing is to then look at its performance over the cycle.
Unfortunately, the company was re-organized in 2019, and I am not sure the pre-2019 performance is a reliable estimate of its future. As such, I used the 2021 to 2023 average contribution margin and capital turnover for my projections.
To represent the current size of the business, I assumed the 2023 revenue. I used the Earnings Power Value model in my valuation because there was no revenue growth track record over the past 9 years.
On such a basis, I found that the intrinsic value of Weatherford was USD 75 per share, compared to its market price of USD 103 per share. There is no margin of safety under this very optimistic scenario.
Note that the lack of a margin of safety was based on an optimistic picture because:
- The 2021 and 2023 average contribution margin and capital turnover are not cyclical averages. Crude oil prices are currently near the top than at the bottom. Thus, the 2021 to 2023 averages are probably the better performances.
- I assumed that there would not be any further asset down and restructuring charges. Historically, during the trough part of the crude oil price cycle, there were impairments and restructuring charges.
Risks and limitations
According to Damodaran, the value of a cyclical company:
“…is often more dependent on the movement of a macro variable…than it is on firm-specific characteristics. Thus, the value of an oil company is inextricably linked to the price of oil…”
“…earnings and cash flows reported in the most recent year are a function of where we are in the cycle, and extrapolating those numbers into the future can result in serious mis-valuations…”
Based on my valuation model, the market is pricing Weatherford on the basis that the revenue, contribution margin, and capital turnover are 6% higher than what I assumed.
You can see that the market is not pricing Weatherford as a cyclical company. It is even extrapolating further improvements from the past 3 years’ average performance.
Secondly, in my valuation, I assume that there was no revenue growth. You may look at the past 3 years’ trend and think that I am wrong.
If you assume a 4% perpetual growth, you will have an intrinsic value of USD 134 per share. In other words, there is a margin of safety. But is growth realistic when the 2023 revenue is lower than that of 2015?
Valuation model
I valued Weatherford based on a single-stage Free Cash Flow to the Firm (FCFF) model where the EBIT was determined based on the business model as shown in the left part of Chart 3.
FCFF = EBIT(1 – t) X (1 – Reinvestment rate) X (1 + g) / (WACC – g).
EBIT = Revenue X contribution margin – Fixed cost.
The Reinvestment rate was derived from the fundamental growth equation g = Return X Reinvestment rate.
Value of equity = Value of firm + cash + Other investments – Debt – Minority interests.
Table 2 illustrates the calculation.
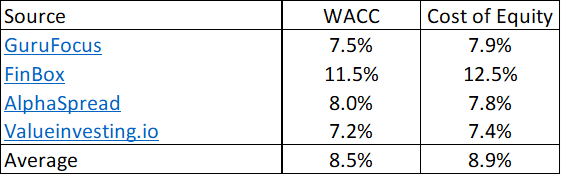
The WACC was based on the first page results of a Google search for “Weatherford WACC”. Refer to Table 3.
Table 2: Estimating the intrinsic value (Author) Table 3: Estimating the cost of funds (Various)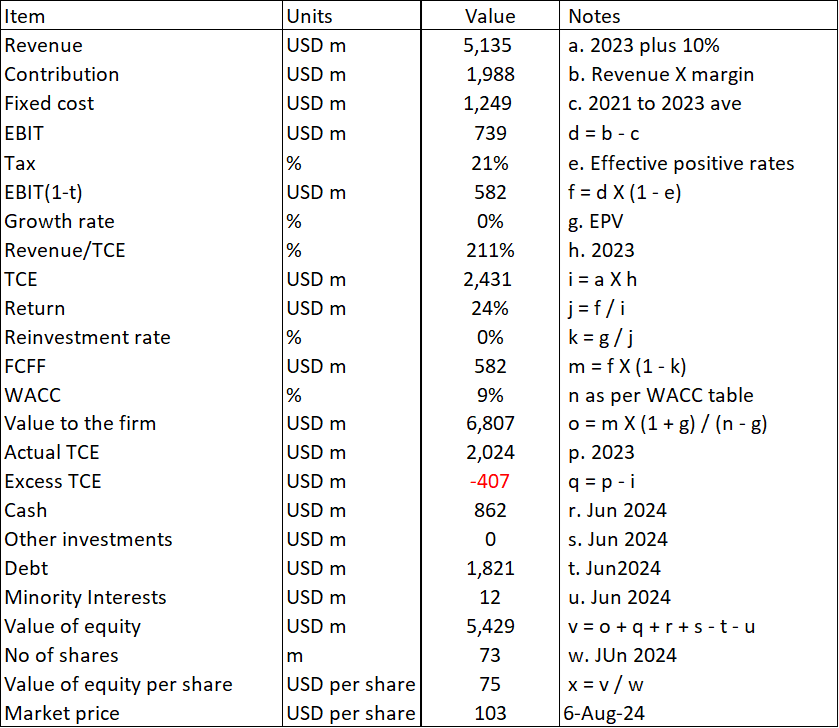
Conclusion
Post its 2019 re-organization, the company’s performance seems to be improving. Revenue and PAT are on an uptrend. There were improving contribution margin, asset turnover, and leverage.
But not all is rosy.
- Gross profitability has been declining, and I have concerns about its financial standing.
- While growing, the 2023 revenue was lower than that in 2015.
Weatherford’s performance is strongly linked to crude oil prices, and I posit that some of the operating improvements are likely due to better crude oil prices, especially when compared to those in 2015.
In addition to not being a wonderful company, my valuation of Weatherford based on its Earnings Power Value and assuming that it is not a cyclical company, does not provide any margin of safety.
If you are a long-term value investor, this is not an investment opportunity, as I expect the performance of Weatherford to decline when the crude oil price goes into the downtrend part of its cycle.