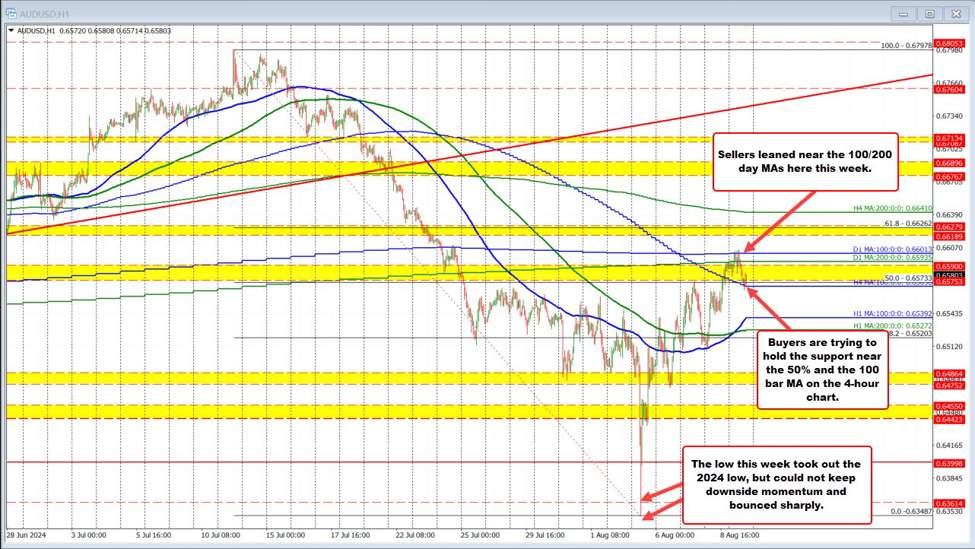
The AUDUSD moved to the lowest level since November 2023 on Monday as Japan stocks plummeted. However, after breaking below the low from 2024 at 0.63614, the price could only make it to 0.6348 before it snapped back to the upside and started to start the recovery. Although that recovery had its fits and starts midweek, the pair ultimately based near its 100 hour moving average, and started its final stretch toward a key cluster of technical levels including the:
- 100-bar moving average on the 4 hour chart currently at 0.6569
- 50% midpoint of the move down from the July high at 0.6573
- 200 day moving average at 0.65935
- 100-day moving out at 0.66013
in trading today, traders tried to break above the 100 day moving average on a number of different hourly bars, but each little break was met with sellers.
Finally buyers turned to sellers and push the price back down toward the low of the cluster of technical levels near 0.6569.
The price remains near those lower levels currently.
If broken, the rising 100-day moving average is 0.6539 would be the next target. If it holds, the 100 and 200-day moving averages remain as key topside resistance.
Buyers and seller are battling between MA support and MA resistance (and the 50% too).
That reminds me, I did an educational video earlier this week on the 100/200 bar MAs. You might want to watch it today or over the weekend.