Data shows the exchange inflows of Tether (USDT) and USD Coin (USDC) have spiked recently. Here’s why this could be relevant for Bitcoin.
Stablecoins Are Observing Higher Than Usual Inflows Right Now
As explained by CryptoQuant author Axel Adler Jr in a new post on X, the monthly average exchange inflow of the top two stablecoins, USDT and USDC, has gone up recently.
The “exchange inflow” here refers to an on-chain indicator that keeps track of the total amount of a given asset being deposited into the wallets associated with centralized exchanges.
When the value of this metric is high, it means the exchanges are receiving a large amount of deposits right now. Such a trend suggests there is demand among the holders to trade away cryptocurrency.
On the other hand, the low indicator implies investors are potentially choosing to hold onto their coins, as they aren’t making many transfers to the exchanges.
What either of these trends may imply for the market, though, depends on the type of asset the one in question is. Investors making deposits for volatile assets like Bitcoin can be a bearish sign for the price, as they may make the transfers for selling.
In the case of stablecoins like USDT and USDC, while deposits can also mean investors want to sell these tokens, such selling would not affect their prices, as they are, by nature, stable in value. That said, they do have relevance for the wider market.
Investors generally store their capital in stablecoins to avoid the volatility of Bitcoin and others. However, investors who store capital like this generally plan to delve back into the volatile side.
Thus, exchange inflows of USDT and other stablecoins can imply that these investors waiting on the sidelines are ready to invest in BTC and the company. This swap can naturally have a bullish effect on the prices of these volatile tokens.
Now, here is a chart that shows the trend in the 30-day and 365-day moving averages (MAs) for the combined exchange inflow of USDT and USDC over the past few years:
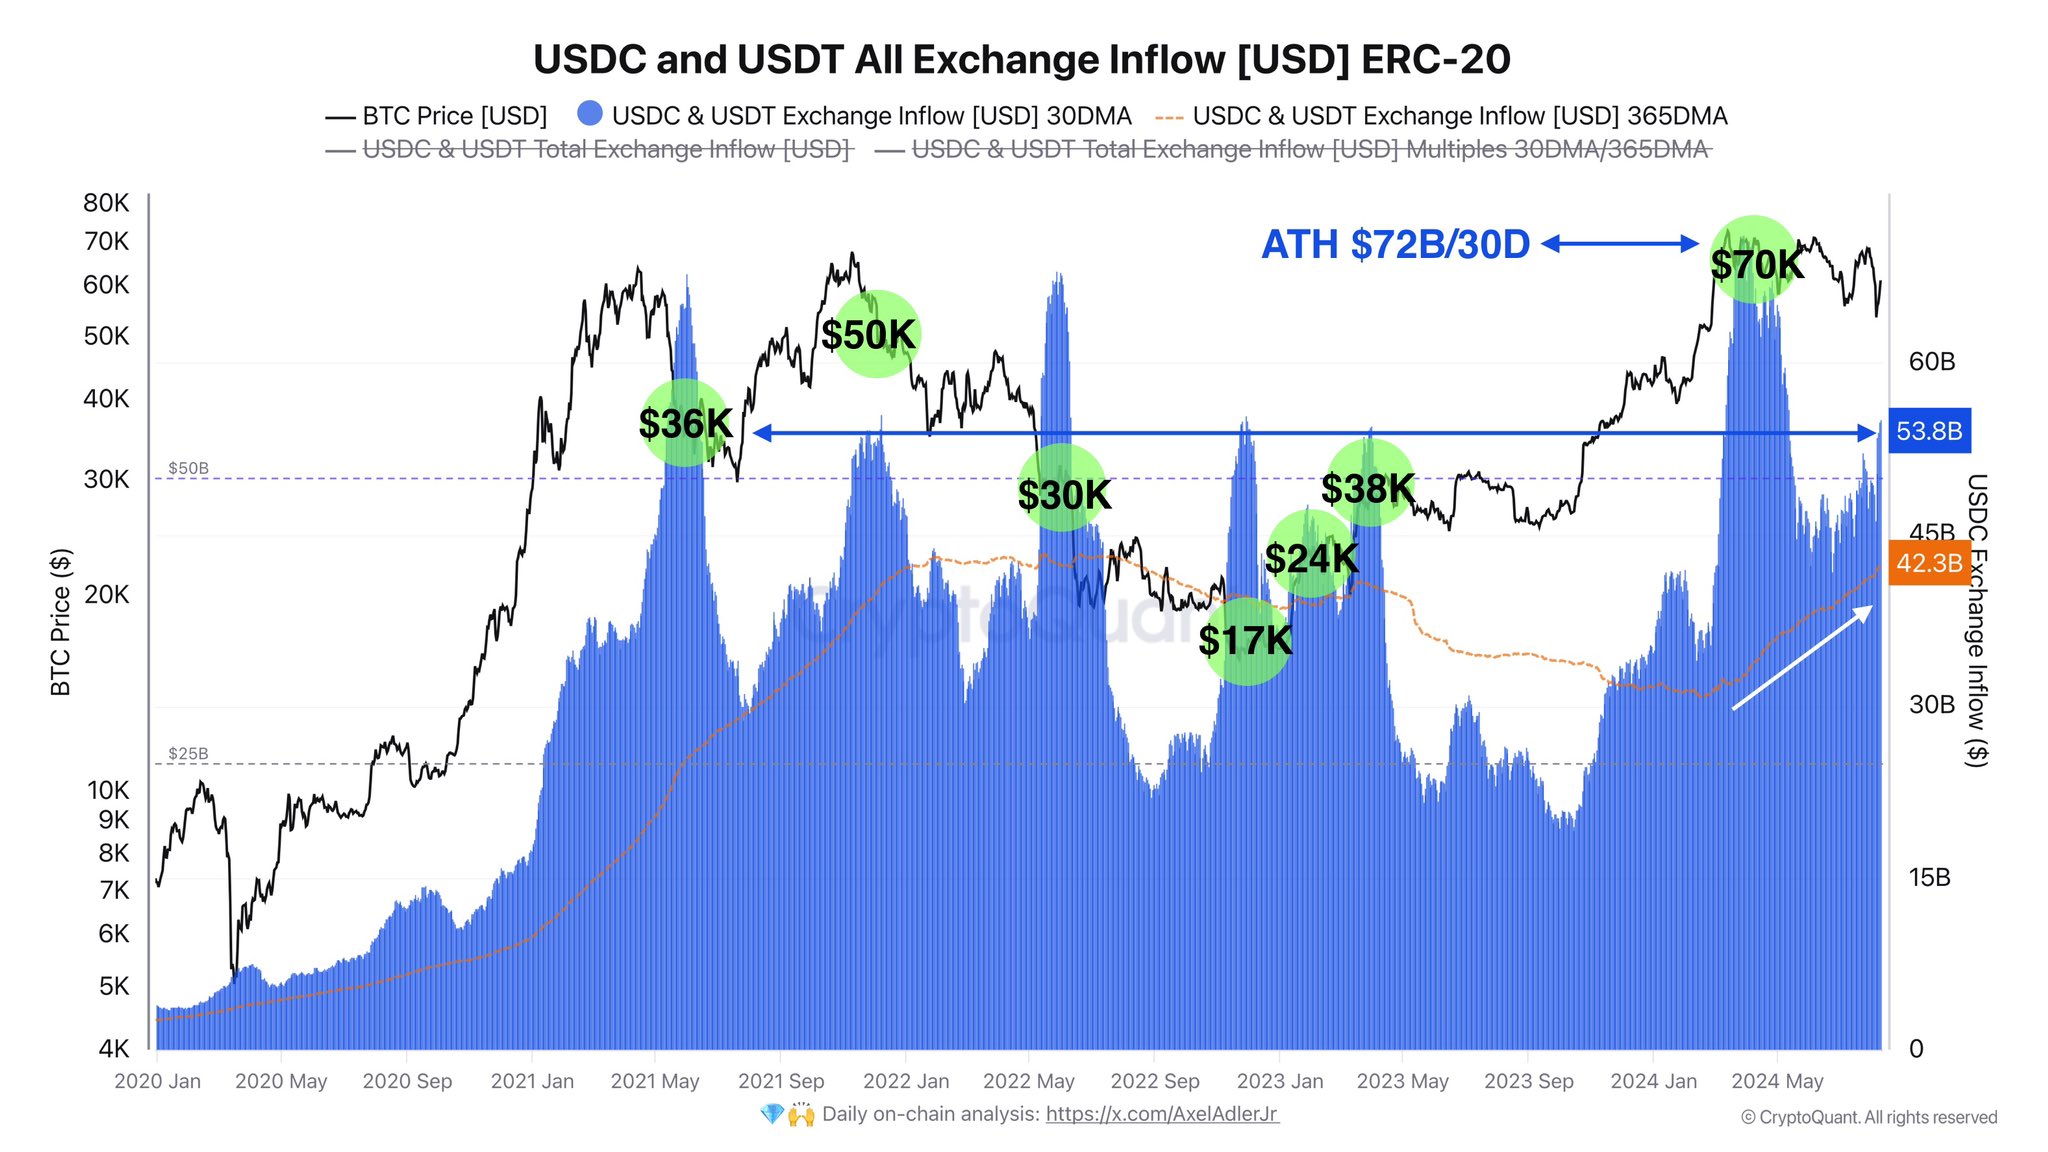
The value of the metric appears to have been heading up in recent days | Source: @AxelAdlerJr on X
As the above graph shows, the 30-day MA USDT and USDC exchange inflows spiked to pretty high levels during the Bitcoin rally towards the new all-time high (ATH), suggesting demand for buying the asset was considerable.
During this surge, the indicator had set a new record of $72 billion in daily deposits. In the downturn that followed, though, the metric had seen a considerable cooldown, but recently, it has been on its way back up.
So far, it has reached the $53.8 billion per day mark, which is quite notable. If these fresh stablecoin deposits are indeed happening for buying into the volatile side, Bitcoin and others can see a bullish effect.
BTC Price
Bitcoin had seen a retrace below $58,000 earlier in the day, but the asset appears to have jumped back up as it has crossed the $60,000 level.
Looks like the price of the coin has overall been moving sideways over the last few days | Source: BTCUSD on TradingView
Featured image from Dall-E, CryptoQuant.com, chart from TradingView.com