Fundamental
Overview
The S&P 500 bounced
strongly from the lows last week following the good US Jobless Claims figures as the data quelled some of
the fears around the labour market after the weak US NFP report.
That’s been also evident
from the market pricing for rate cuts as expectations for a 50 bps cut in
September kept on being pared back with now a 25 bps move seen as more likely.
Moreover, the Japanese markets shouldn’t be a problem anymore given that the
Japanese officials made it pretty clear that they won’t proceed with more
tightening given the recent volatility in the markets.
All of the above
contributed to a more positive risk sentiment in the market with the focus now
on the US CPI report tomorrow where benign figures will likely give the bulls
some more support.
S&P 500
Technical Analysis – Daily Timeframe
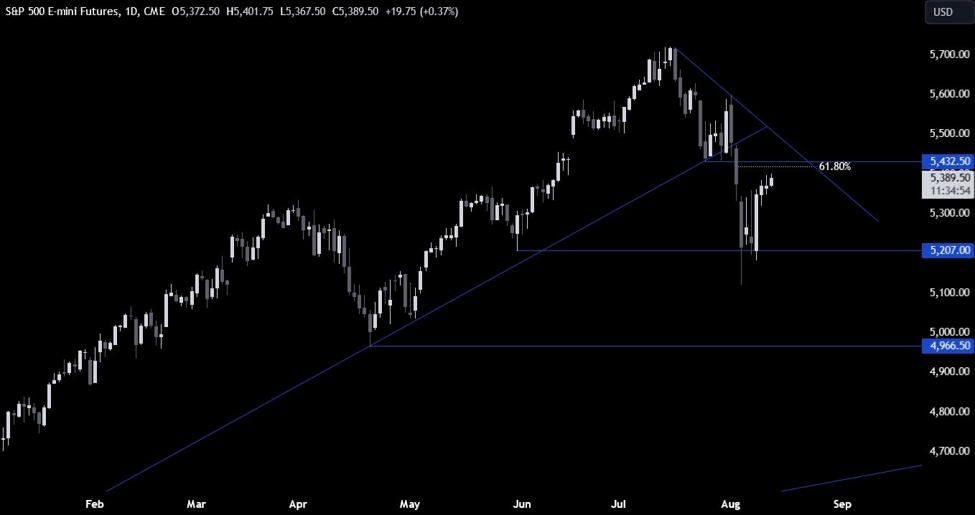
S&P 500 Daily
On the daily chart, we can
see that the S&P 500 bounced around the swing low level at 5200 and extended
the gains following the good US jobless claims figures. The price is now
approaching a key resistance
around the 5430 level where we can also find the 61.8% Fibonacci
retracement level for confluence.
This is where we can expect
the sellers to step in with a defined risk above the level to position for a
drop back into the lows. The buyers, on the other hand, will want to see the
price breaking higher to increase the bullish bets into the major trendline
targeting a breakout.
S&P 500 Technical
Analysis – 4 hour Timeframe
S&P 500 4 hour
On the 4 hour chart, we can
see that the price recently broke above the strong resistance around the 5366
level and extended the gains as more buyers piled in. The price action has been
tentative though as we head into the US CPI report tomorrow.
If we get a bigger
pullback, the buyers will likely lean on the upward trendline
around the 5270 level to position for a rally into the major downward
trendline. The sellers, on the other hand, will want to see the price breaking
lower to increase the bearish bets into the lows.
S&P 500 Technical
Analysis – 1 hour Timeframe
S&P 500 1 hour
On the 1 hour chart, we can
see more clearly the recent price action. There’s not much we can glean from
this timeframe as market participants will wait for a catalysts or the price
reaching the key levels. The red lines define the average daily range for today.
Upcoming
Catalysts
Today we get the US PPI data. Tomorrow, we have the US CPI report. On
Thursday, we get the US Retail Sales and Jobless Claims figures. Finally, on
Friday, we conclude the week with the University of Michigan Consumer Sentiment
survey.