The latest insights from Glassnode’s “Week Onchain” newsletter reveals a major shift in Bitcoin market dynamics as long-term holders (LTHs) and large investors appear to be resuming a pattern of accumulation. This trend marks a departure from the extensive distribution observed earlier this year, offering a potential bullish outlook for Bitcoin, despite the broader market’s ongoing volatility.
The Bullish Arguments For Bitcoin
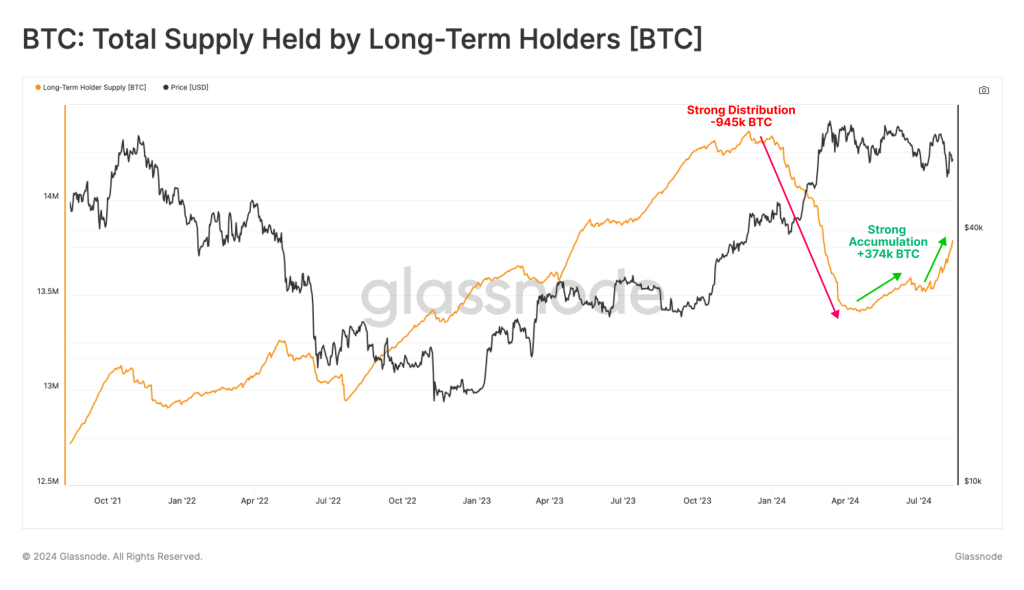
The Bitcoin market has been characterized by a challenging environment over recent months, marked by significant distribution, especially following the all-time high (ATH) set in March 2024. This distribution phase, which saw active participation from wallets of all sizes, is now showing signs of reversal. Particularly noteworthy is the behavior of large wallets, often associated with institutional investors and exchange-traded funds (ETFs), which are now shifting towards accumulation.
The Accumulation Trend Score (ATS), a metric that evaluates weighted balance changes across the market, has reached its maximum value of 1.0, signaling significant accumulation over the last month. This uptick in accumulation is also reflected in the activity of Long-Term Holders (LTHs), who, after a period of heavy divestment, have added approximately 374,000 BTC to their holdings over the past three months.
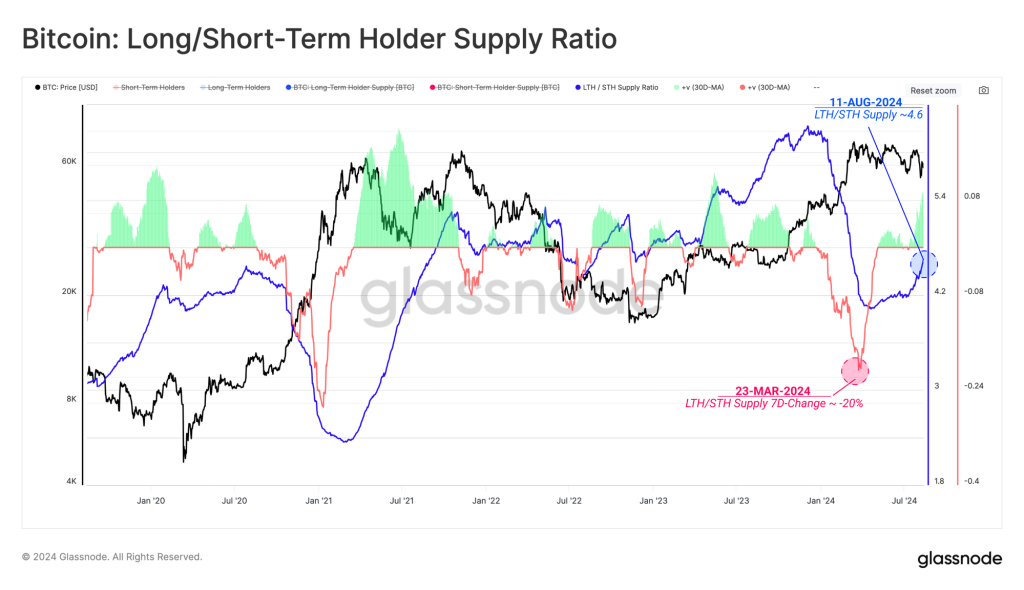
LTHs, who play a crucial role in the Bitcoin ecosystem, are once again expressing a strong preference for holding their coins. The 7-day change in LTH supply has returned to positive territory, underscoring a reduced propensity for selling and an increased focus on accumulation. Despite the aggressive distribution from April to July, Bitcoin’s spot price has managed to stay above the Active Investor Cost Basis, a critical threshold that delineates bullish and bearish investor sentiment.
“The market’s ability to find support near this level speaks to underlying strength,” the report notes, “suggesting that investors are generally still anticipating positive market momentum in the short to medium term.”
The Bearish Arguments
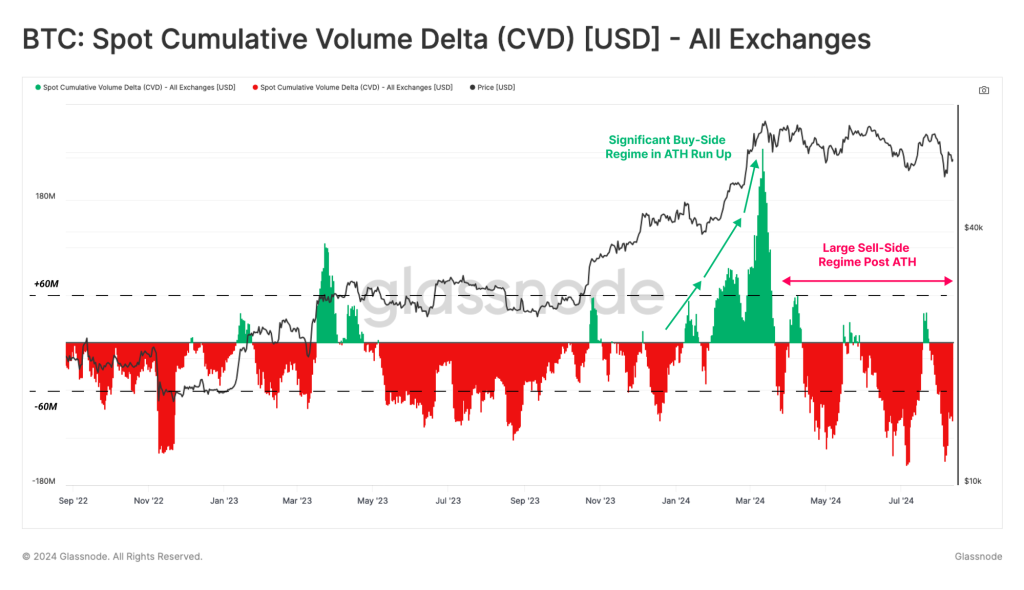
The market is not without its challenges. The Cumulative Volume Delta (CVD) metric, which estimates the net balance between buying and selling pressure in spot markets, indicates a persistent net sell-side pressure. The median value of Spot CVD has fluctuated between -$22 million and -$50 million over the last two years, reflecting a consistent sell-side bias.
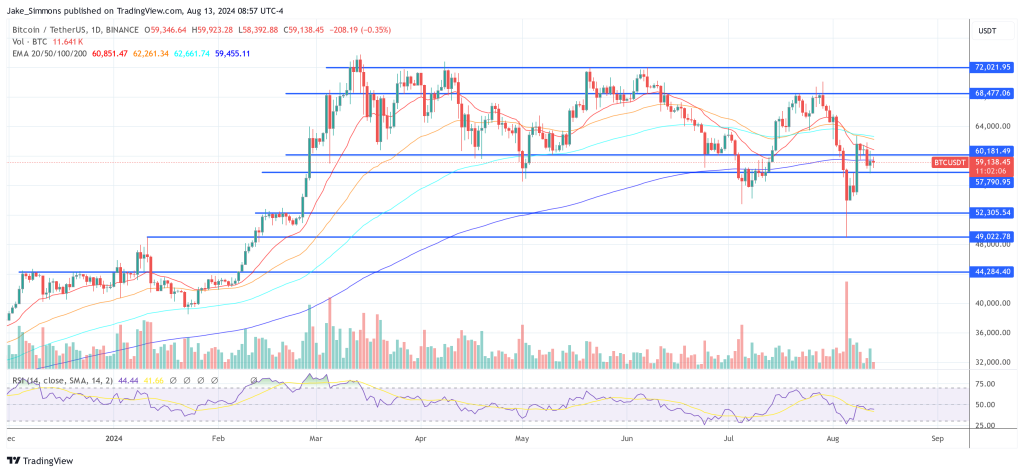
Interestingly, the adjusted variant of the CVD metric, which accounts for this bias, has shown a potential confluence with the recent failure to break above the $70,000 resistance level. This suggests that the weakness in spot demand has contributed to this technical resistance, but a recovery in demand could be signaled if the adjusted CVD returns to positive values.
The ongoing accumulation by LTHs, despite the choppy sideways price action, indicates a resilient and patient holder base. The percentage of Bitcoin network wealth held by LTHs remains elevated compared to previous ATH breakouts, signaling that these investors are unwilling to sell at current prices and may be waiting for higher levels before increasing their distribution.
The LTH Sell-Side Risk Ratio, a metric that gauges realized profit and loss relative to the market’s Realized Cap, remains lower than in previous cycles. This suggests that the profit-taking by LTHs is relatively muted, further implying that these holders are not yet inclined to liquidate their positions.
The return to accumulation by Bitcoin holders, particularly LTHs, is a potentially bullish indicator for the market. The combination of resilient holder behavior, elevated network wealth held by long-term investors, and a strategic focus on accumulation despite recent market volatility points to a strong underlying conviction among investors. These developments could set the stage for a significant upward move by Bitcoin.
At press time, BTC traded at $59,138.
Featured image created with DALL.E, chart from TradingView.com