
Lemon_tm
GLD ETF and recession
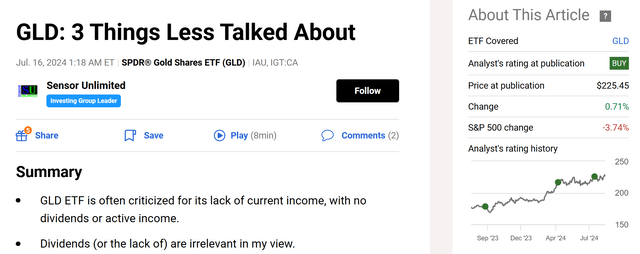
I last wrote on the SPDR Gold Shares ETF (NYSEARCA:GLD) about a month ago. As you can see from the screenshot below, that article was titled “GLD: 3 Things Less Talked About” and was published on the Seeking Alpha platform on July 16, 2024. In that article, I took a long-term view and argued why I see gold as a core holding in our portfolio.

Seeking Alpha
Since then, there have been a few material changes in the macroeconomic landscape. The top one on my mind is that the possibility of a hard landing is a far more likely scenario now. In particular, the unemployment rate rose to 4.3% according to July’s job report. The rise is widely considered a trigger point of the Sahm Rule. The market is now much more concerned about the potential that the drastic interest hikes in recent years may cause a hard landing/recession in the near future.
Against this backdrop, I think it would be helpful for this follow-up article to take a near-term perspective and specifically focus on the role of GLD in the case of a hard landing. As such, the remainder of this article will examine GLD’s historical performance during recent market downturns. The analysis demonstrates that GLD has historically served as effective hedges during such times – something you probably already know.
But I bet the key takeaway is something new to most investors – despite its notorious commodity nature, GLD has actually demonstrated LOWER volatility and equal recovery time during major downturns compared to the overall equity market. I thus think the new developments since my last writing have enhanced GLD’s timeliness as a hedge against a potential hard landing.
GLD ETF: some basic and not-so-basic information
In case there are readers new to the fund, GLD is the first ETF to market that invests directly in physical gold and also the largest in terms of AUM in this space to the best of my knowledge. As detailed in its fund description below (the emphases were added by me):
GLD tracks the gold spot price, less expenses and liabilities, using gold bars held in London vaults. The product structure reduced the difficulties of buying, storing and insuring physical gold bullion for investors. Actively traded, the shares provide deep liquidity. Its structure as a grantor trust protects investors, trustees cannot lend the gold bars. However, taxes on long-term gains can be steep, as GLD is deemed a collectible by the IRS.
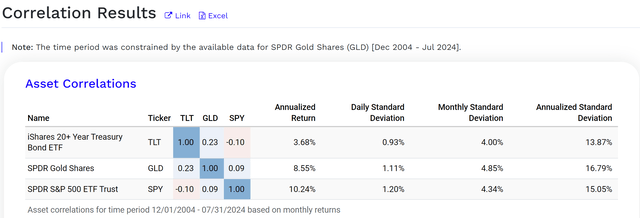
Most investors must be well aware of GLD’s role in diversification. Indeed, GLD has historically demonstrated a very low correlation with both the bond and the equity market, as represented by the iShares 20+ Year Treasury Bond ETF (TLT) and SPDR S&P 500 ETF Trust (SPY), respectively. The chart below shows the correlation of GLD ETF relative to TLT and SPY. As seen, GLD has a low correlation coefficient of 0.23 with TLT and an even lower correlation of 0.09 with SPY, supporting the use of GLD as a diversifier within a portfolio.
If we examine historical data deeper, a few things might surprise you. GLD is characterized as a community fund and is often criticized for its price volatility. This notoriety, like many other things, really depends on how you measure it. For instance, GLD’s annual standard deviation was around 16.8% as seen in the chart below, indeed noticeably higher than SPY’s 15%.

Portfolio Visualizer
However, the picture can change if our focus shifts. As an example, the chart below compares the performance of GLD and SPY ETF across more metrics. Since the main concern of this article is the potential for a recession, I want to draw your attention to the worst year performance and maximum drawdowns. As seen, GLD has featured far less severe worst-year loss than SPY (-10.67% vs. -18.17%) and maximum drawdown (-18.08% vs. -23.93%) historically.
And next, you will see that its hedging role does not stop here.


Portfolio Visualizer
GLD ETF: drawdowns and recovery time
Let’s first expand our analysis from the worst drawdowns to the top 5 drawdowns to make sure our view is not biased by one single data point. The next two charts below show the details of the top 5 drawdowns for GLD and SPY in the past 10 years. As seen, GLD has suffered less severe drawdowns in 4 out of the 5 cases.


Portfolio Visualizer


Portfolio Visualizer
During market downturns, the recovery time is equally important – especially when you actively withdraw. Extended underwater duration can create extreme financial hardship and also emotional stress. The charts above also show the recovery time for GLD and SPY during their top 5 drawdowns. As seen, the recovery time varies significantly for both funds. For GLD, the longest recovery took 2 years and 6 months for a drawdown that started in August 2016. In contrast, the shortest recovery was just 1 month for a drawdown in May 2016. On average, the median recovery time for GLD is 4 months among its top 5 worst drawdowns, the same as SPY’s median recovery time during its top 5 drawdowns.
Other risks and final thoughts
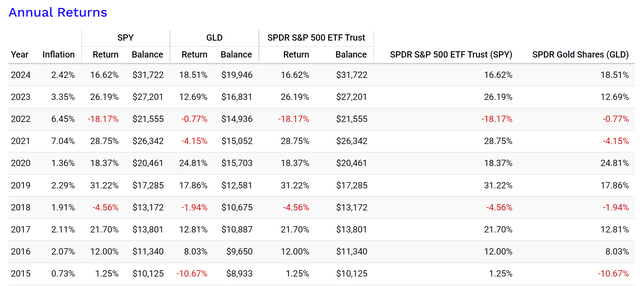
Finally, let’s also examine the timing of the drawdowns. The chart below compares the annual returns of GLD and SPY in the past 10 years. As seen, SPY experienced 2 annual losses during the past 10 years. In both cases, the inclusion of GLD could have substantially reduced the losses. Notably, in 2022, when SPY experienced a significant loss of -18.17%, GLD only declined by -0.77%. To a lesser degree, in 2018, during another market downturn, GLD’s loss of -1.94% was significantly smaller than SPY’s -4.56%.

Portfolio Visualizer
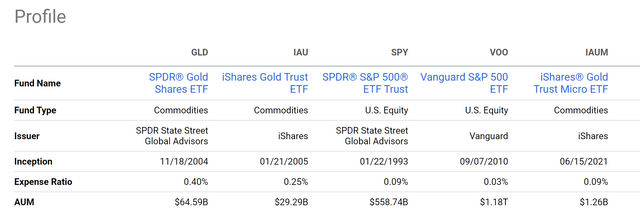
In terms of downside risks, GLD charges a relatively high fee of 0.40%. This is much higher than large indexed equity funds such as SPY. As seen in the next chart below, it is also higher than many other gold funds. Notably, the recently launched iShares Gold Micro ETF (IAUM) features a fee of only 0.09%, comparable to SPY already. If you recall from an earlier chart, over the past 10 years, GLD generated a return of 7.47% per year. A 0.4% expense ratio thus translates into about 5% of the annual return, not a negligible drag. As aforementioned, gains from GLD can be taxed at a higher rate as the ETF is treated as a collectible by the IRS. The tax headwinds therefore should also be part of the investment consideration.
To close, let me clarify that I am not trying to imply that SPY (or equity in general) is a bad investment. The point I want to make is that recent developments have made GLD a timely hedge against a potential hard landing. Most investors are familiar with GLD’s low correlation to other asset classes such as bonds and equity. However, a closer look at the magnitude, recovery time, and timing of its worst drawdowns reveals its hedging role to be far more potent than the correlation coefficient shows.

Seeking Alpha

