Fundamental
Overview
The price action in the Russell 2000 has been mostly rangebound in the past
couple of weeks although the sentiment continues to favour more upside. The “growth
scare” after the ISM Manufacturing PMI and the NFP report looks to be behind us
thanks to the US Jobless Claims last week.
This week we got some more positive news on the inflation front as the US
PPI surprised to the downside and the US
CPI yesterday showed some more easing. That should be good news as the Fed
will likely be even more dovish from now on and the chances of three rate cuts
by year-end solidify.
Russell 2000
Technical Analysis – Daily Timeframe
Russell 2000 Daily
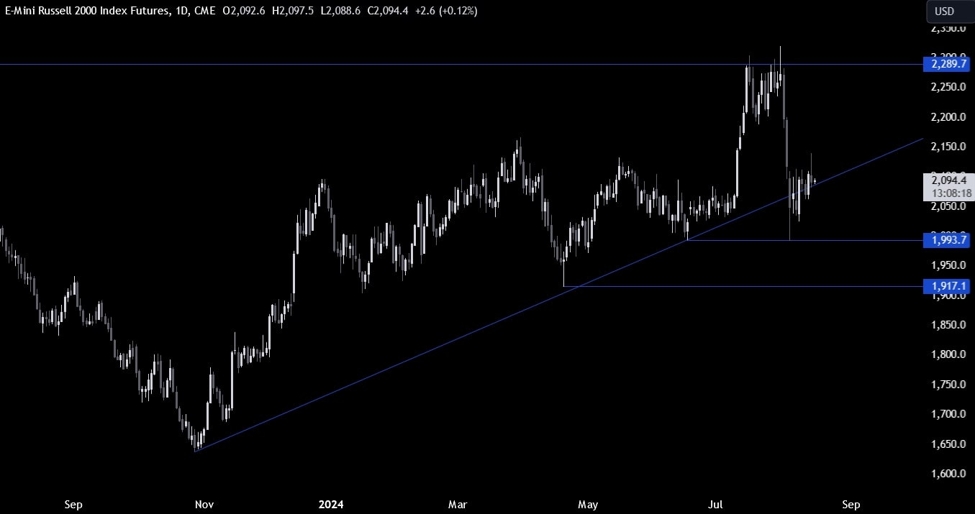
On the daily chart, we can
see that the Russell 2000 is trading above the major trendline which should give the buyers some
more confidence on further gains ahead as the sentiment remains positive. The
sellers, on the other hand, will want to see the price falling back below the
trendline to start looking for selling opportunities.
Russell 2000 Technical
Analysis – 4 hour Timeframe
Russell 2000 4 hour
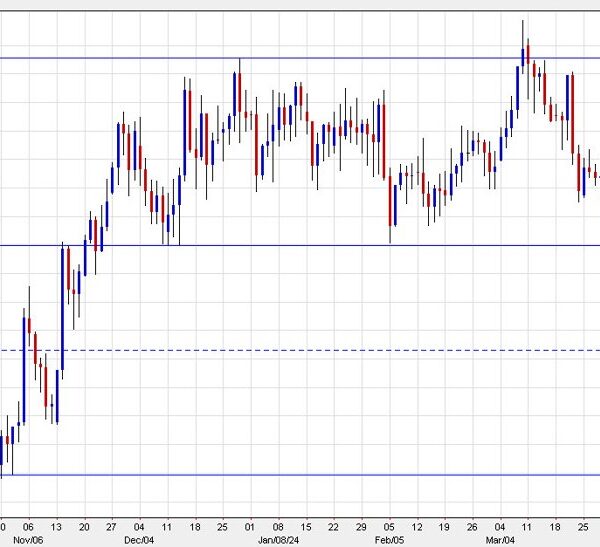
On the 4 hour chart, we can
see that we have a strong resistance around the 2110 level where the
price got rejected from several times. Yesterday, the price probed above the
resistance following the benign US CPI report but eventually gave back all the
gains and fell below the resistance zone.
We can see that the price
has been printing higher lows nonetheless, which signals that the bullish structure
remains intact. The price action formed an ascending
triangle. The price can break on either side of the pattern but what
follows next is generally a more sustained move in the direction of the
breakout.
Russell 2000 Technical
Analysis – 1 hour Timeframe
Russell 2000 1 hour
On the 1 hour chart, we can
see more clearly the recent price action. The buyers will likely lean on the minor
trendline to position for a break above the resistance with a better risk to
reward setup and increase the bullish bets on an eventual breakout.
The sellers, on the other hand,
will keep on stepping in around the resistance and look for a break below the
minor trendline to increase the bearish bets into the 1993 level. The red lines
define the average daily range for today.
Upcoming
Catalysts
Today we get the US Retail Sales and Jobless Claims figures. Tomorrow, we
conclude the week with the University of Michigan Consumer Sentiment survey.