tiero
On July 16, the S&P hit a record high, and the S&P volatility index’s VIX bottomed at 12, compared to a historical average of 19.5.
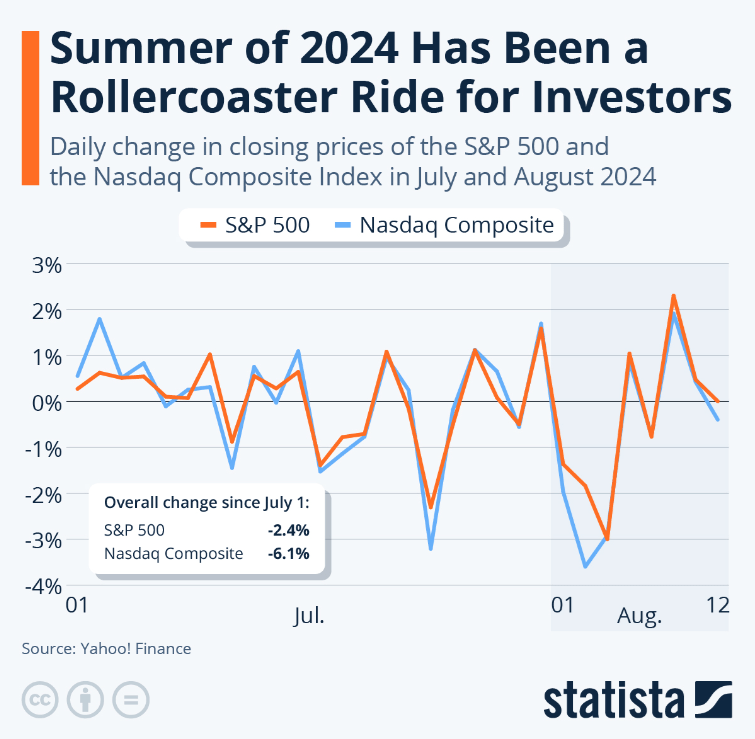
Statista
On Aug. 7, the VIX hit 65, and the stock market went from drifting almost straight up all year to some wild swings, as much as 4.3% in a single day.
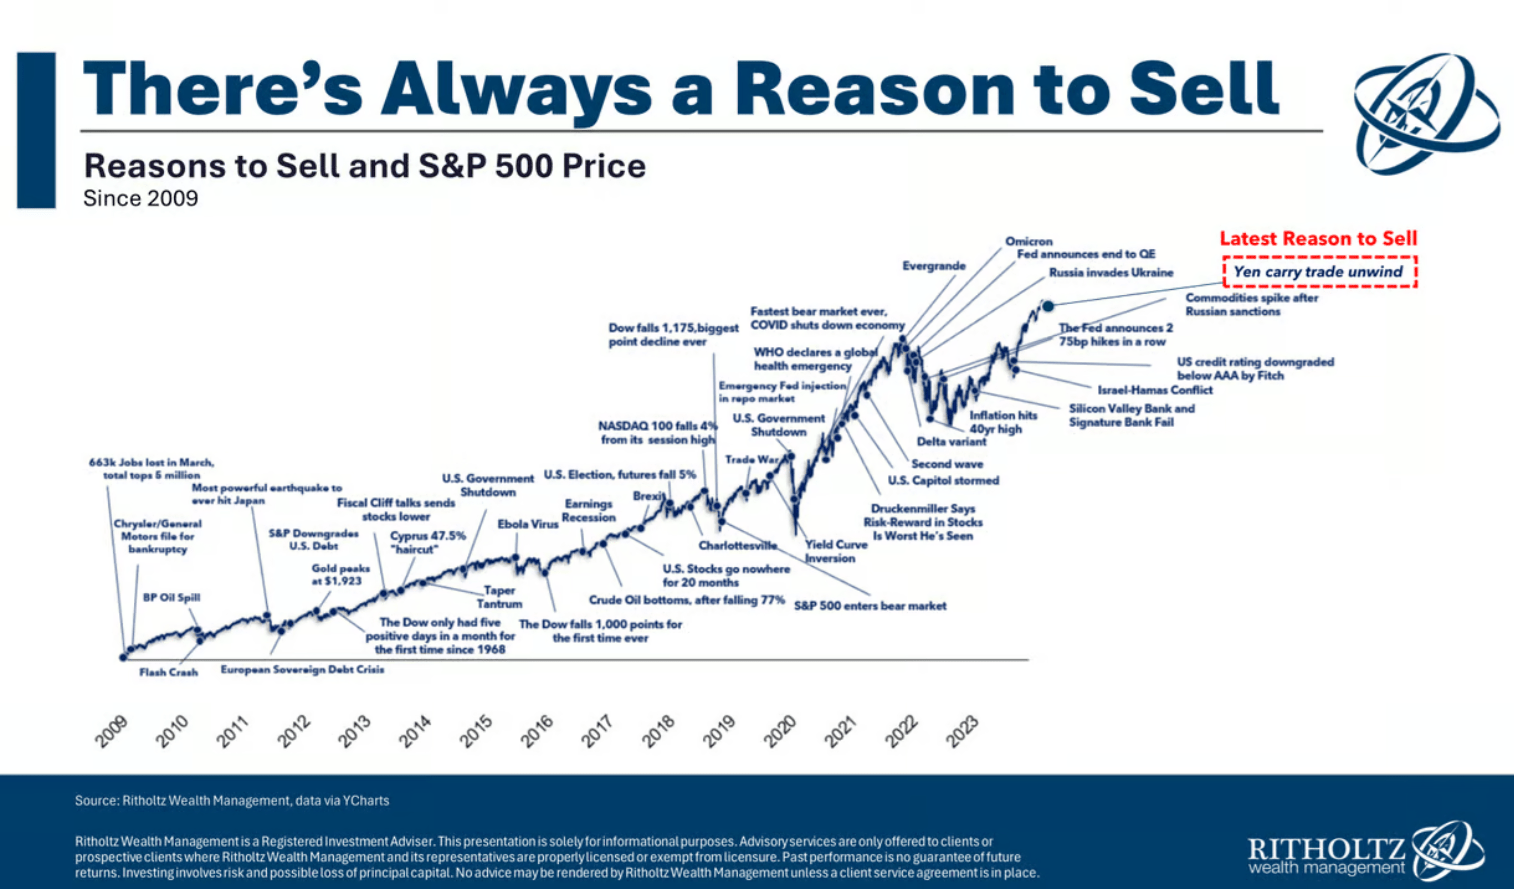
Volatility Is The Smart Investor’s Best Friend
Ritholtz Wealth Management
Since 1990, the S&P’s average daily price volatility has been 1.22%. That’s what a 19.5 average VIX means.
In other words, on any given day, the S&P usually goes up or down 1.22%, and the media’s job is to pretend they know why.
The financial media, from CNBC to Bloomberg to Fox Business, has one job: Fill air time.
They need to sell ads, and that means keeping people watching. So, like political pundits this year, they will rehash the same news all day long, bringing on as many economists and chief strategists from Schwab, JPMorgan, Bank of America, Wells Fargo, etc., as possible.
Each will talk convincingly about what might happen because of X, Y, and Z.
And the honest ones will admit that none of this matters for long-term investors, only traders.
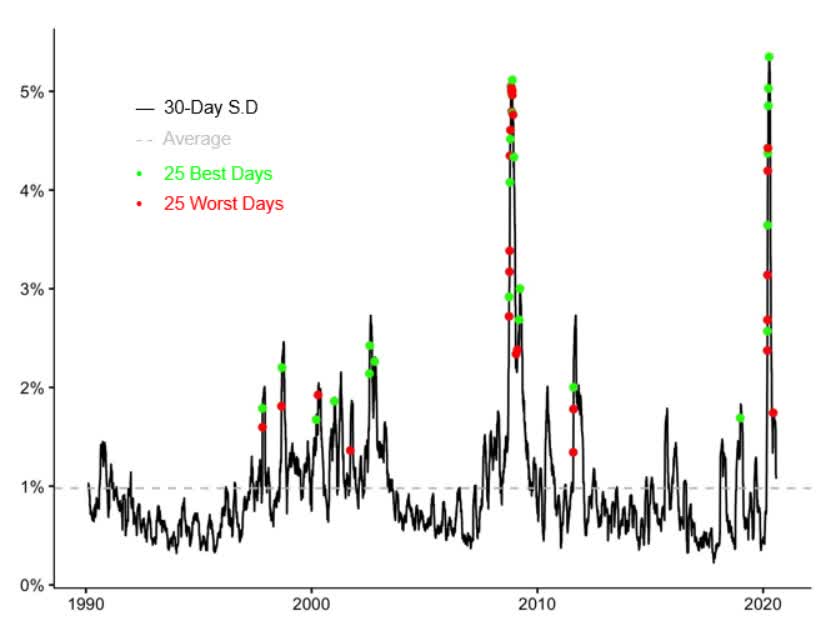
Ben Carlson
80% of the market’s best days come within two weeks of the worst days.
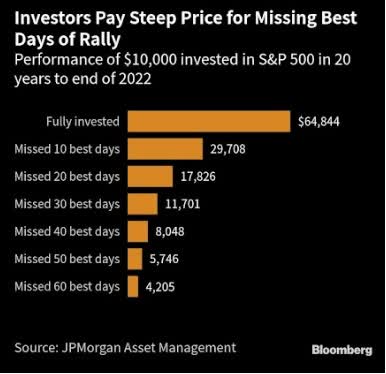
Bloomberg
If you miss the best days by sitting out corrections, you risk turning the best long-term investing strategy in history into a guaranteed losing strategy.
From 2002 to 2022, missing just the top 10 stock days out of 5,000 days cut returns by over 50%. Instead of a 548% gain, it was just 197%.
If you miss the top 20 days, averaging the best day of each year, the gains drop to 78%.
Missing the top 30 days cut 20-year returns to 12%.
Missing the top 40 days, the best two days of each year on average, cut the return to -20%.
Missing the best 60 days, the top three days of each year on average, resulted in $10,000 becoming $4,205, a 58% loss.
Over these 20 years, inflation has been 67%.
In other words, missing just 60 of the market’s best days out of 5,040 market days, just three days each year on average, the best 1.2% of days, resulted in inflation-adjusted losses of 75%.
Adjusted for inflation, the largest stock market crash in history was a 65% decline in the Great Depression.
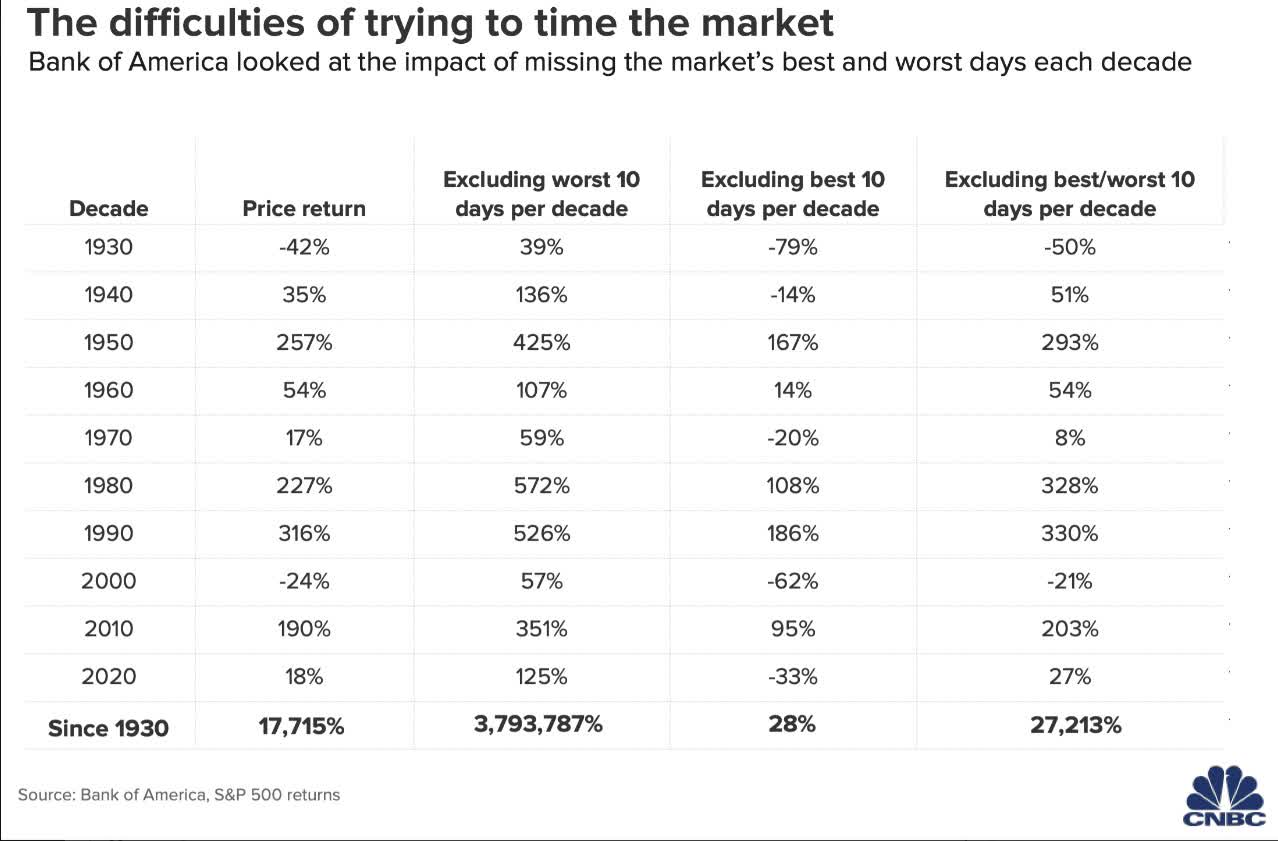
Bank of America
From 1930 to 2022, missing the best ten days of each decade, an average of the best market day of each year, took a 17,715% gain in stocks (including the Great Depression) to 28%.
Adjusted for inflation, that’s a 94% loss over 90 years, during which the stock market delivered life-changing gains superior to those of any other major asset class.
In other words, if you are tempted to sit out market volatility until “the dust settles,” you misunderstand the nature of the stock market.
Stocks don’t deliver 7% inflation-adjusted returns over time despite high volatility, 5X more than bonds, but precisely because of this high volatility.
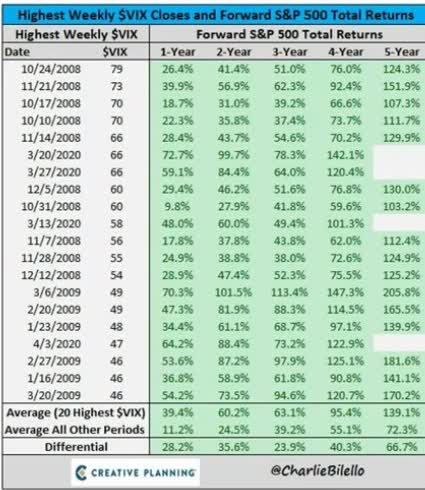
Charlie Bilello
Stocks don’t fall 20% into a bear market and then take 2.5 years to break even through 10% steady gains off the bottom.
Stocks fall hard and fast, then rip higher off the bottom. The higher the volatility, the faster the crash and recovery.
The average one-year gain after the 20 highest recorded VIX readings was almost 40%.
- Buffett’s historical returns are 20% per year over 55 years.
- Peter Lynch’s historical returns: 29% per year for 13 years.
- Joel Greenblatt: 44% annual returns for 21 years.
Investors can achieve short-term returns on par with the greatest investors in history by buying during periods of high market volatility.
As we just saw, the average five-year annualized return for stocks following volatility spikes is 15% annually, a 139% return. That’s compared to 10% annually over the long term.
In other words, if you are afraid of volatility, your risk management is not right for your needs, and your portfolio is not optimized to meet your financial goals and emotional risk profile.
The Great “Market Crash” Of 2024 In Context
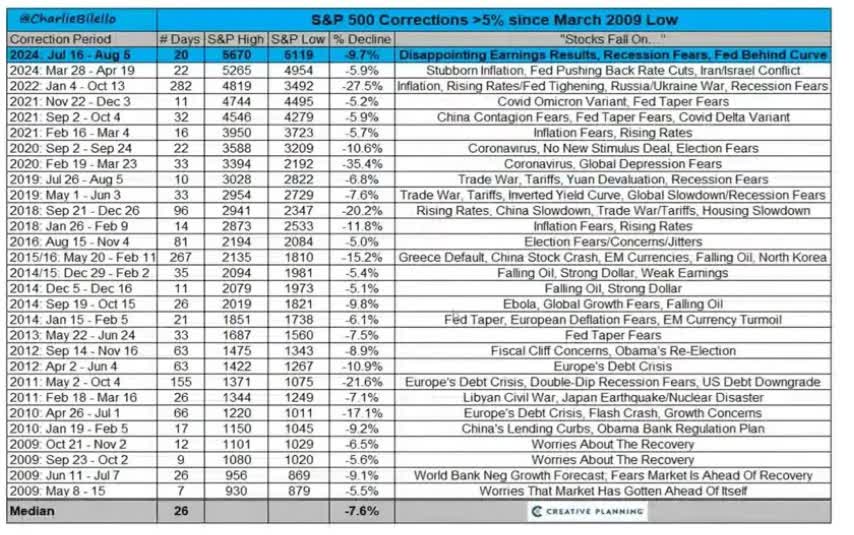
Charlie Bilello
This market pullback peaked at a 9.7% decline on Aug. 7, when the S&P hit -4.3% and the VIX hit 65. Some stocks, like Nvidia (NVDA) fell 35% from record highs.
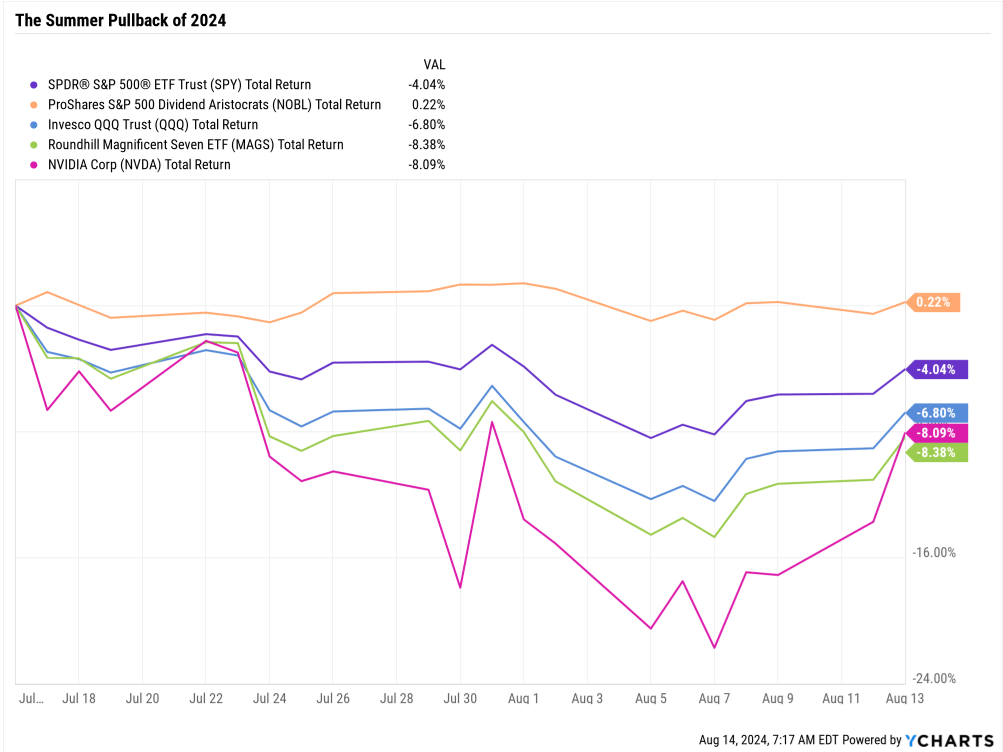
Ycharts
When stocks are falling, investors naturally feel fear that declines will continue.
“Oh my God, Nvidia is down 16% in one day!” That’s a headline.
“Oh my God, Nvdia’s fundamentals haven’t fallen 16% in a day, but the stock has! Buy more!” This is what the headline should be, but in times of peak panic selling, like Monday, Aug. 7, you’ll seldom see or hear such headlines in financial media.
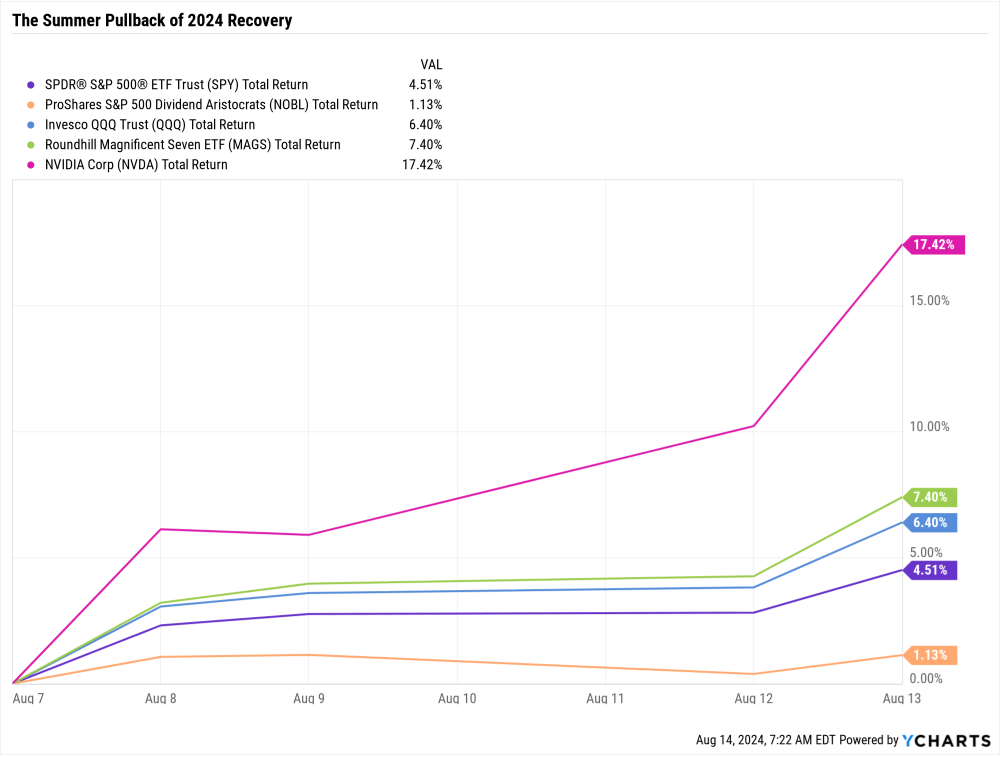
Ycharts
The upside of volatility is that stocks usually explode higher when the fear abates, doesn’t end, and abates a bit.
And the growth scare isn’t even over yet!
Ritholtz Wealth Management
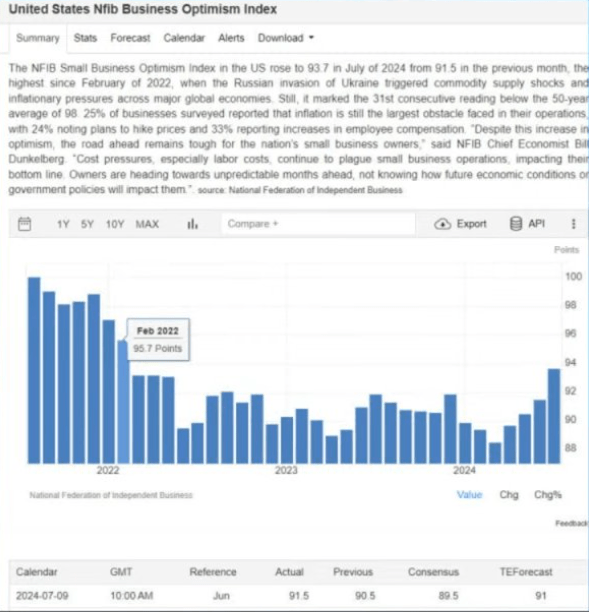
Small businesses hiring 55% of Americans have seen their confidence soar to the highest level in two years.
Ritholtz Wealth Management
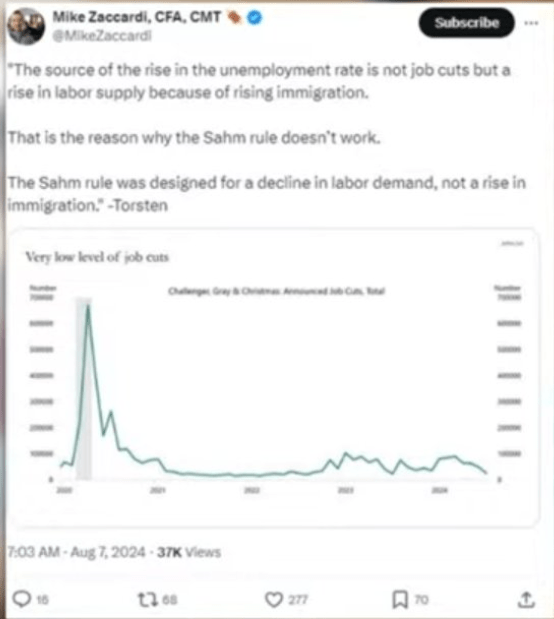
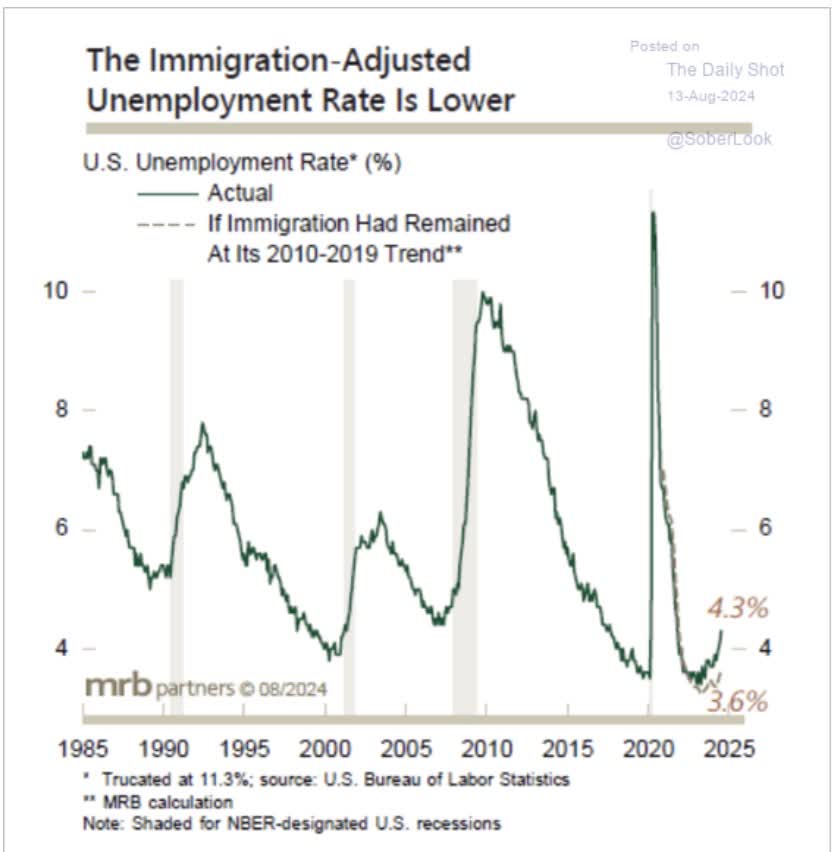
Rising unemployment is due to higher immigration, not job cuts.
Daily Shot
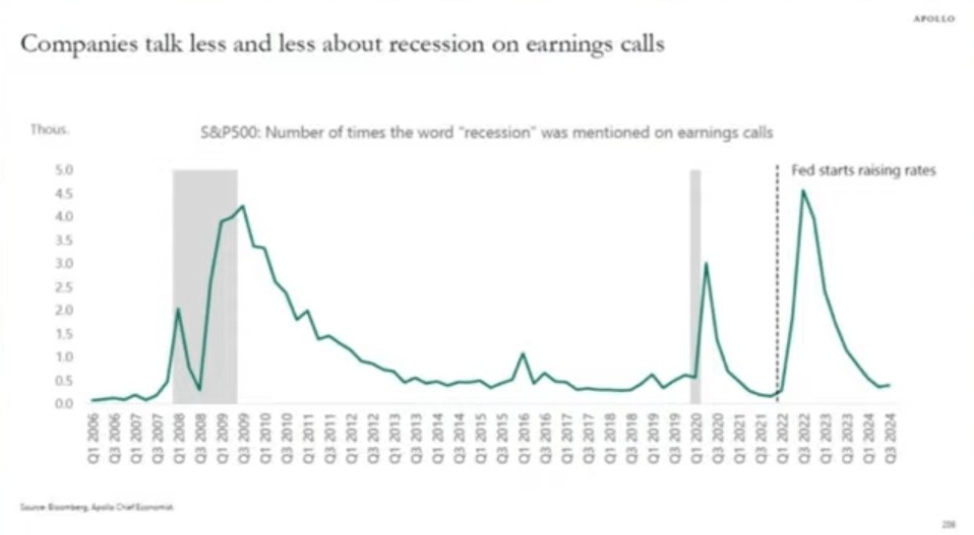
And let’s not forget that corporate America’s job is to see recessions coming.
Daily Shot
Mentions of recession in conference calls are down 90% from Q3 2022’s peak.
These facts have been available for the entire pullback. However, some stocks fell 4.3% daily (Aug. 7), and some fell 25% (Intel (INTC)).
When the media pundits declare “the soft landing is back on,” stocks will likely be at record highs.
When the VIX is over 60, don’t overthink. Shut up and buy something.” Joshua Brown, CEO Ritholtz Wealth Management
OK, but what now? What if you’re a Dividend Aristocrat investor, sleeping well at night because you are 100% invested in the world’s most dependable dividend growers?
Stable blue chips that have been raising dividends, rain or shine, for 25-plus years?
The aristocrats only fell 1% at the peak of the panic and are actually up since the July 16 market peak.
The aristocrats never fell, so there are no aristocrat bargains, right? Wrong!
How To Find The Best Dividend Aristocrat Bargains
Let me explain how I quickly and easily find the best aristocrat bargains.
Not just by looking at a metric like PE or a historical discount to fair value.
| Screening Criteria | Companies Remaining | % Of Master List | |
| 1 |
Add “12-month fundamentally justified upside, 5-year total return potential, and dividend growth streaks” Under “Columns.” |
0.00% | |
| 2 | Under Lists “Dividend Champions” | 129 | 25.70% |
| 3 | BHS rating (reasonable buy, good buy, strong buy, very strong buy, ultra value buy) | 89 | 17.73% |
| 4 | Non Speculative | 77 | 15.34% |
| 5 | Quality Rating 10+ (blue-chip, SWAN, Super SWAN, Ultra SWAN) | 76 | 15.14% |
| 6 | Investment Grade Credit Rating (BBB- Or Higher) | 56 | 11.16% |
| 7 | Consensus Long-Term Return Potential 10+% | 28 | 5.58% |
| 8 | 5-Year Consensus Annualized Return Potential 10+% | 24 | 4.78% |
| 9 |
Sort By Discount To Fair Value |
0.00% | |
| 10 | 13+% discount to fair value cutoff | 10 | 1.99% |
| Total Time | 2 minutes |
I start by screening for dividend champions, every company with a 25-plus year dividend growth streak.
The dividend aristocrats are S&P companies with 25-plus year streaks. Anything not in the S&P, including MLPs (like EPD), foreign stocks (ENB or BTI), or companies too small to be in the S&P 500 (like CFR and CSL) are not official aristocrats, but that’s a technicality only.
Next, I screen out anything that’s overvalued. On Aug. 7, when the S&P hit -9.7%, 5% of the S&P (26 companies) hit record highs.
Always and forever, it’s a market of stocks, not a stock market.
Next, I screen out anything speculative, not just junk bond rated, but also turnaround stocks.
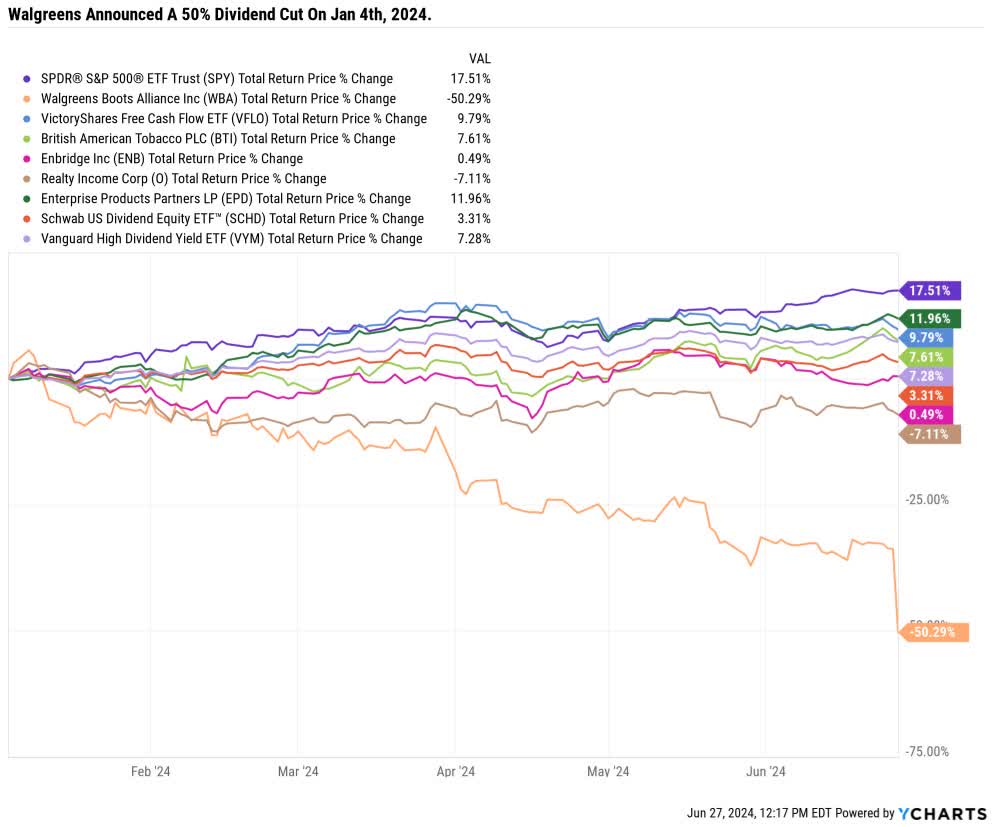
Ycharts
Turnaround stocks like Walgreens (WBA), 3M (MMM), V.F Corp (VFC), or Intel (INTC) are at high risk of dividend cuts, and all of these companies did cut in the last two years.
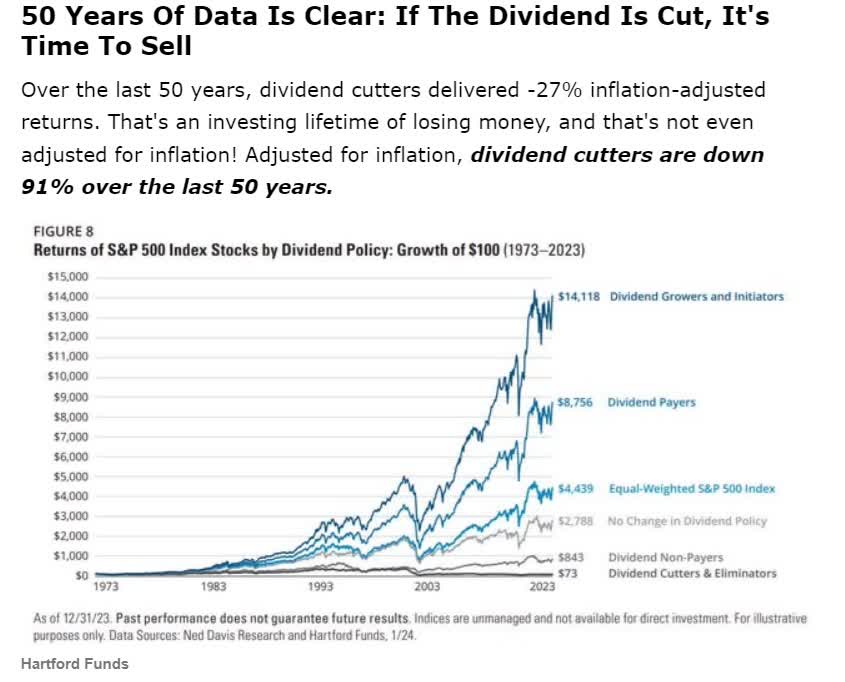
Hartford Funds
While there are always exceptions, like Buffett’s favorite oil company (Occidental), the historical data is clear. Statistically, if a dividend is cut, the thesis is broken, and selling and never looking back is the best move.
That’s also why I screen for blue-chip quality or higher.
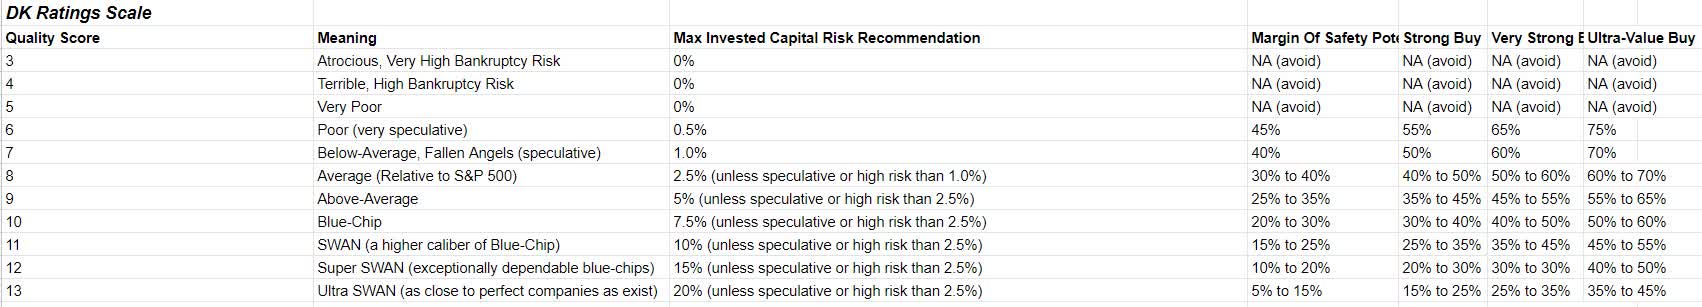
Dividend Kings
Blue chips, SWANs (sleep well at night), Super SWANs (aristocrat-level quality), and Ultra SWANs (wide moat aristocrat quality) minimize the risk of owning catastrophic companies.
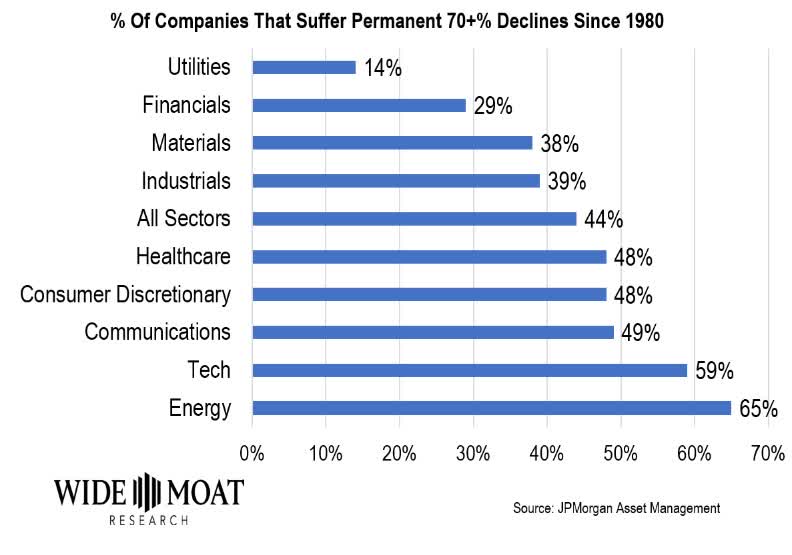
Wide Moat Research
Most people know that stocks always recover eventually. That’s true for the broader indexes.
Individual companies tend to be underperformers or outright disasters, falling 70%-plus and never recovering.
That’s the “creative destruction” of capitalism at work.
The winners win big, and most companies aren’t winners.
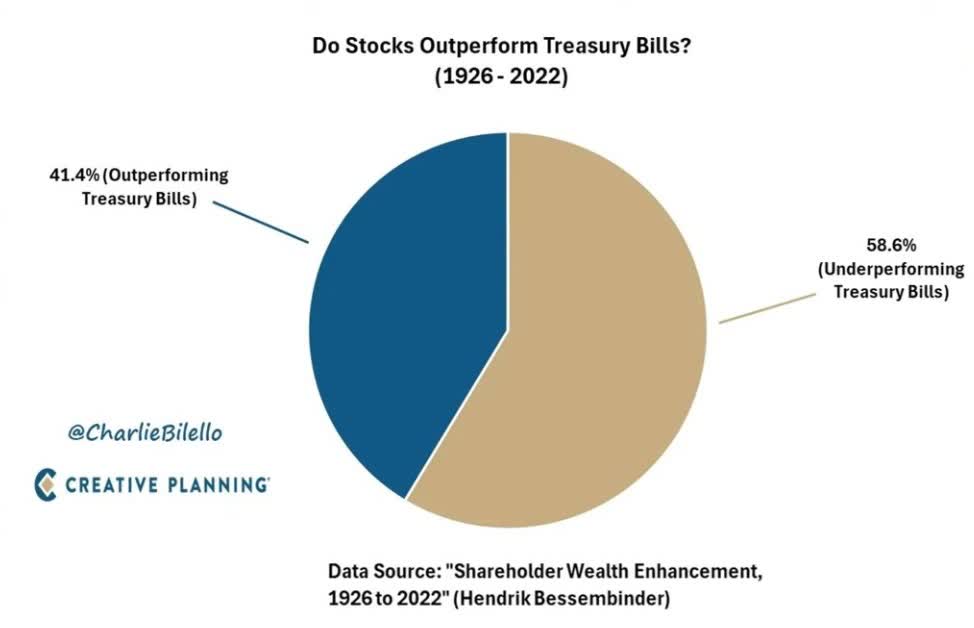
Charlie Bilello
Most companies don’t outperform risk-free T-bills (CASH).
Charlie Bilello
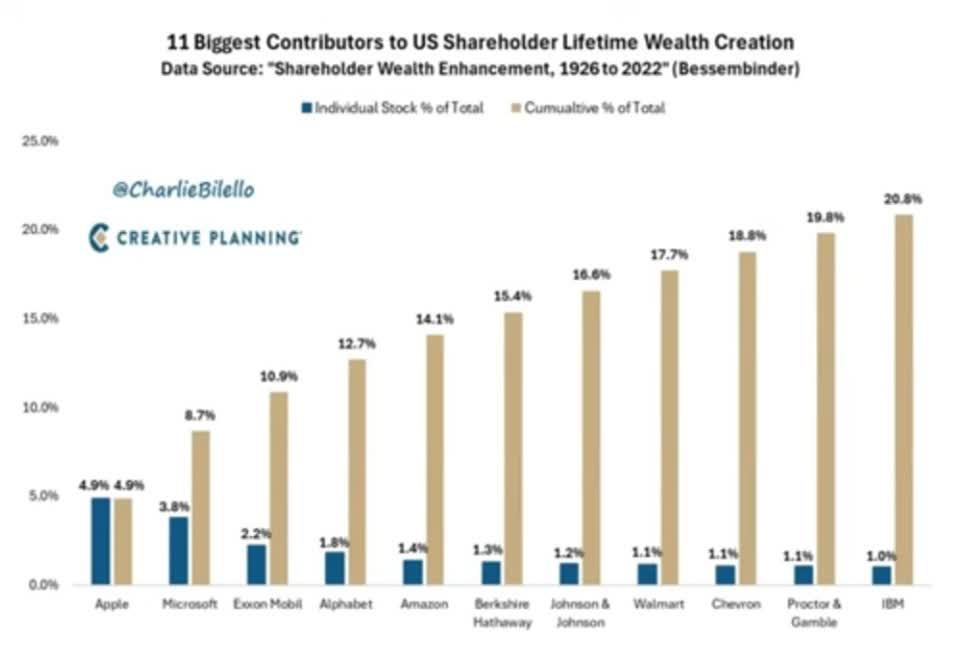
Like the best days of the S&P drive almost 100% of the long-term returns, virtually all of the market’s long-term returns come from a handful of mega winners.
And some mega winners are no longer good investments, like IBM (IBM) or Apple (AAPL).
- Apple’s consensus long-term returns going forward are sub 9%.
- Not bad returns, but not likely to outperform the S&P.
Since safety and quality are so important to avoiding dividend cuts, permanent 70%-plus declines, and simply owning companies that underperform cash, I double down on safety by screening for investment-grade credit ratings.
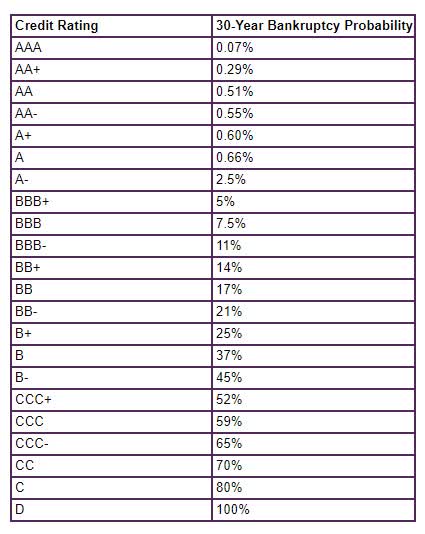
S&P
BBB- or better credit ratings means an 11% or less bankruptcy risk (1 in 9) over the next 30 years.
A-rated companies are much lower risk, and with AAA-rated Microsoft (MSFT) and Johnson & Johnson (JNJ), you can reduce the risk of losing 100% of your money (bankruptcy) to as low as 1 in 1,429.
But all this focus on quality causes us to forget something very important.
Safety and quality never drive returns directly; only yield, growth, and valuation changes do.
Ritholtz Wealth Management
A utility with a 1% yield and 1% growth, purchased at fair value, will earn 2% long-term returns and income growth (1% dividend growth).
The bond market estimates that the long-term T-bill yield will be 3%.
So it doesn’t matter if the 1% yielding utility has an AAA credit rating and 100% quality score; it’s just not going to be a good investment.
After all, while the risk of such a utility might be 1 in 1,259 of losing all your money, the risk-free return is 3%, higher returns for less risk.
That’s why I set a total return screen cutoff at 10%, the market’s historical return. While any stock can underperform the market in the short term, as long as the long-term yield plus growth is likely double digits, this minimizes the risk of the portfolio underperforming.
Market envy, aka “fear of missing out,” is a real risk to investors who lose their minds and abandon prudent portfolio strategies in exchange for chasing momentum.
The same is true for five-year consensus return potential. In other words, what kind of returns can investors expect if a company grows as the analyst consensus expects and trades at historical market-determined fair value five years from now, including dividends?
I set this cutoff at 11% since we aim to achieve slightly better than double-digit returns courtesy of a discount to fair value.
This creates a 24-dividend aristocrat watchlist, and I then rank by historical discount to fair value.
That estimate is based on two things.
- Yield vs. five-year average yield: Relative carry method aka “Dividend yield theory.”
- 12-month forward PE vs. 10 to 20-year average PE.
Pacer Funds
The reason I use these two valuation metrics is twofold.
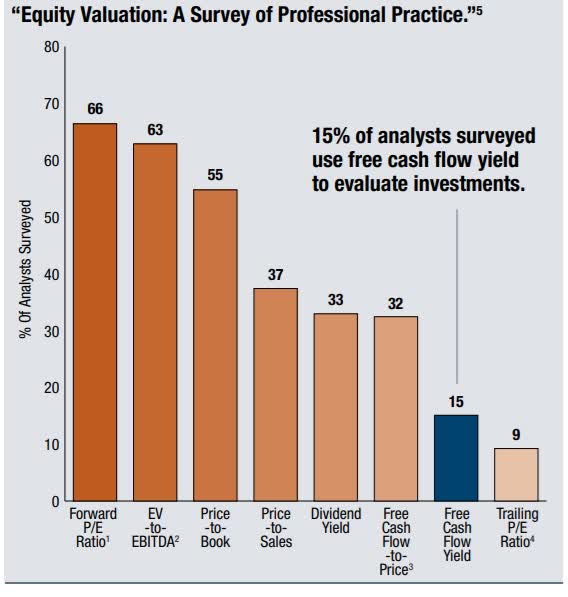
First, forward PE is the most popular on Wall Street. Since value is what others are willing to pay, it’s useful to know what 66% of fund managers see and interpret.
For example, if a stock has a historical PE of 20 and $5 in 2024 consensus EPS and $6 in 2025 EPS, then at mid-year in 2024, the PE fair value for 2024 is $100, and for 2025, it is $105.
The 12-month blended forward PE fair value is $102.5.
We also add dividend yield fair value for two reasons.
First, if a company is being re-rated due to slower growth rates, then the five-year average yield will give a warning, a tripwire of “cheaper for a reason.”
For example, imagine a 5% yielding stock growing at 10%, historically delivering 15% returns. If the growth rate slows to 5%, then the yield should be expected to be re-rated higher in the long term, since the 15% return investors are used to would require a 10% yield to achieve.
Using a 25-year average yield (as YieldChart offers) would result in overestimating the fair value of a dividend stock for well over a decade after growth has slowed and the new fair value yield has risen.
However, there is one other reason we use dividend yield plus 12-month forward PE.
Consider a cyclical dividend aristocrat like Chevron (CVX).
Chevron’s fair value is a function of operating cash flow (more stable than earnings) but is still highly volatile.
Chevron is owned for its dividend stability and dependability. So what if cash flow is cut in half in an oil crash?
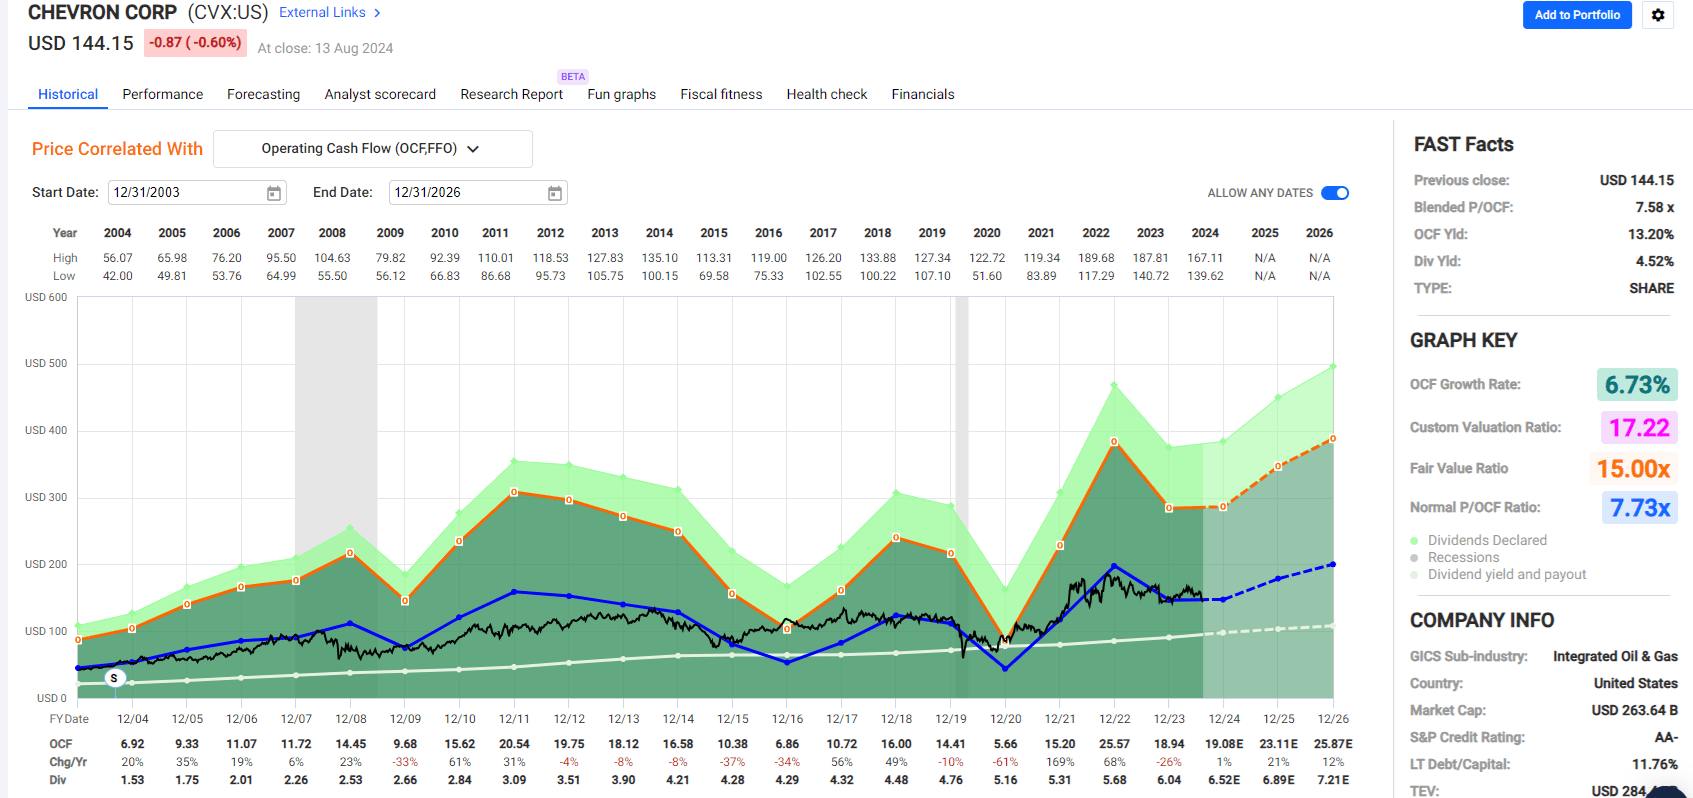
FAST Graphs, FactSet
Look at how closely CVX tracks the 7.73X 20-year average price to cash flow. This is an excellent estimate of fair value, and it doesn’t require analyst upgrades or complex methods like discounted cash flow models.
But what happens when CVX’s operating cash flow falls 65% during the pandemic oil crash?
Does CVX’s fair value fall 65%?
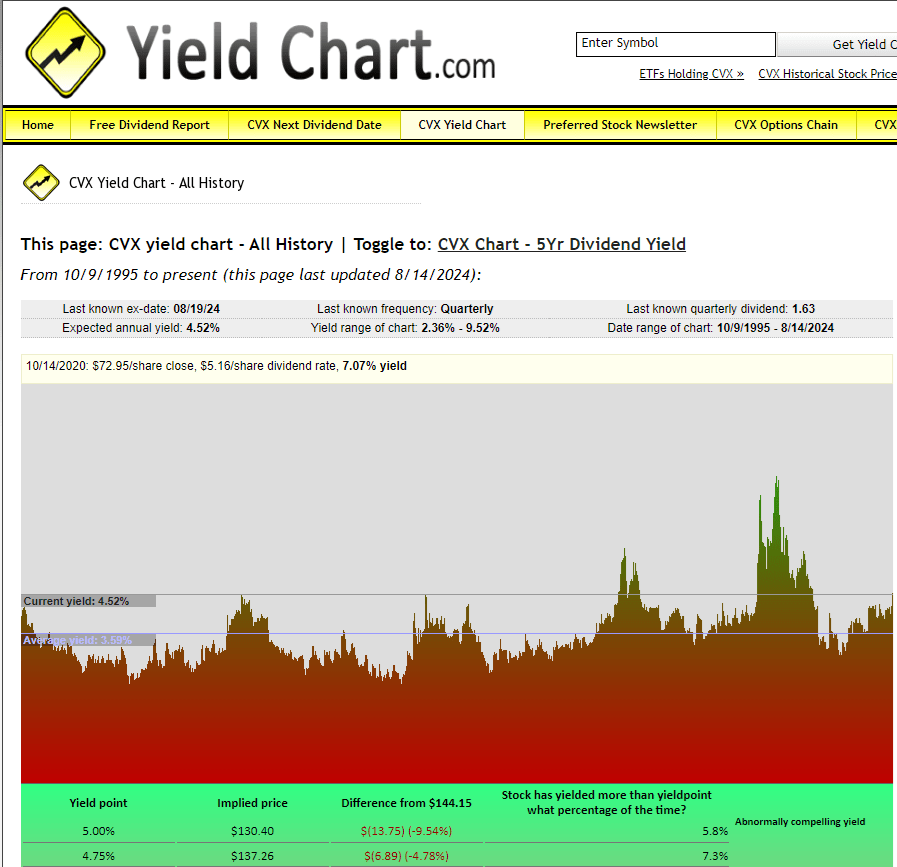
YieldChart
CVX’s yield peaked during the Pandemic at 9.52%, 3X its 25-year average, and more than 2X higher than the 4.2% five-year yield.
The five-year yield warns whether “this time is different” for Chevron. Investors might demand a higher yield than in the past (by 0.6%) since, eventually, the end of oil will end, and Chevron will have to pivot to providing green energy.
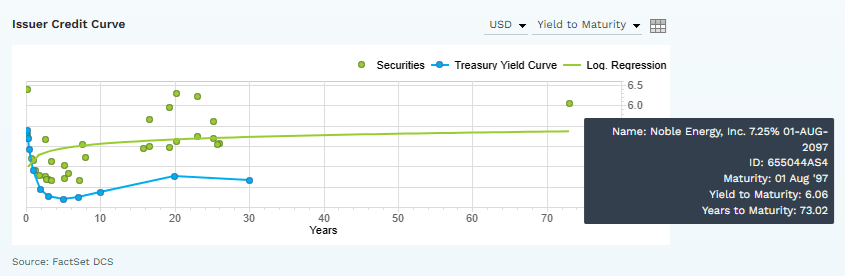
FactSet
CVX’s median analyst growth consensus is 7%, similar to the 7% growth rate of the last 20 years. The bond market is willing to buy 73-year bonds, indicating that the “smart money” on Wall Street is confident that CVX will still be around and paying its debt in 2097.
So, for a company like CVX, we average the fair value yield of 4.2% with the 12-month forward price/operating cash flow fair value to estimate $184.93 fair value right now and $187.76 by year-end.
Each passing week, CVX approaches its year-end fair value as the 12-month forward fair value shifts closer to 2025 results.
We update the latest consensus estimates every quarter after earnings, and when the dividend is raised, we also update this.
This allows for a largely automated, real-time shifting of fair value based on the best available consensus estimates.
As fair value vs. price shifts daily, the ratings we use for companies change based on their quality rating and whether or not the company is speculative.
It’s a 100% rules-based, quantitative approach to rating companies on safety, quality, valuation, and estimating total return potential, risk-adjusted return potential, and inflation-adjusted risk-adjusted return potential.
This drives our research terminal and 100% of my investment recommendations, portfolio decisions, and my family’s portfolio.
In this case, a 13% discount to fair value cuts off the 24 remaining dividend aristocrats to the top 10 bargains.
Bargains that are not just blue-chip quality aristocrats but also non-speculative, investment grade, with 10%-plus short and long-term return potential and a 13% to 31% discount to historical fair value.
Thanks to the research terminal, which we’ve spent over five years building, all this takes just two minutes.
10 Dividend Aristocrat Bargain Buys You Don’t Want To Miss
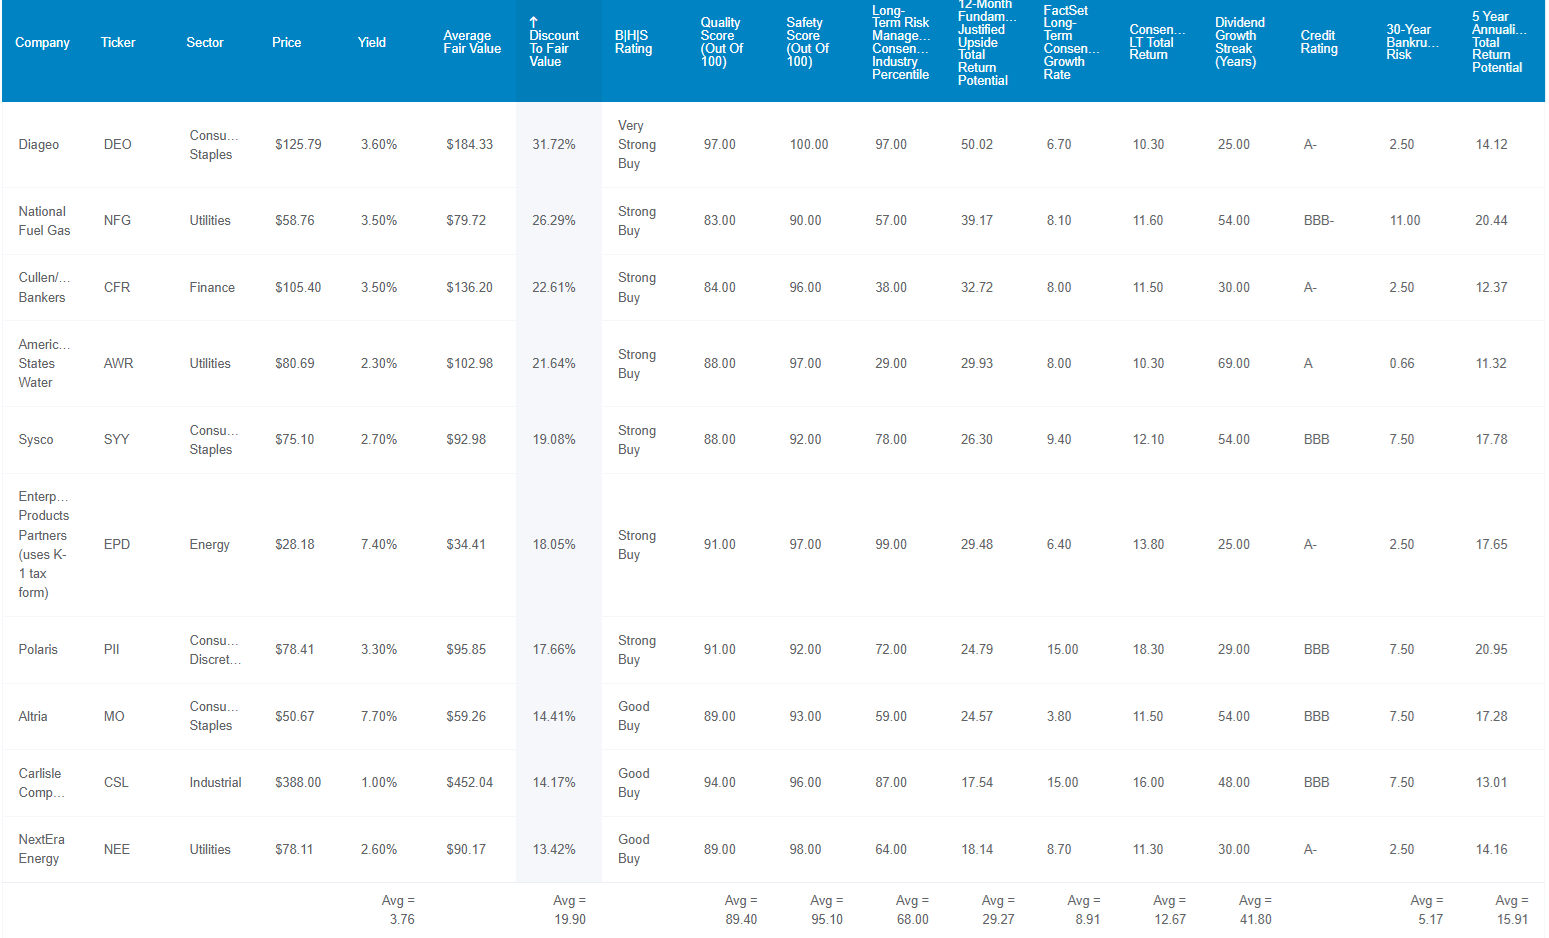
Dividend Kings Zen Research Terminal
Fundamental Summary
Ten aristocrats in seven sectors represent an entire portfolio.
One that yields 3.8%, more than Vanguard High-Yield ETF (VYM), matching SCHD’s 4% forward yield.
However, unlike the dividend aristocrats, which are fairly valued right now, these aristocrats are 20% undervalued. That means you’re buying $1 in value for $0.80.
If these 10 aristocrats popped 25% tomorrow, that would be 100% justified by fundamentals. That’s the power of buying great companies at such a steep discount.
95% dividend safety and 89% overall quality based on over 1,000 metrics mean Ultra SWAN quality and very low dividend cut risk.
- 0.5% risk of dividend cuts outside of a recession.
- Sub 1% risk in a mild recession.
- Sub 2% risk in a severe recession.
The average dividend streak is 42 years, meaning this portfolio’s dividends have risen yearly since 1982.
- Through seven bear markets.
- And four recessions.
- The Great Recession and Pandemic.
- Interest rates from 0.3% to 15%.
S&P rates them BBB+ stable with a 5.2% 30-year bankruptcy risk.
S&P also rates them in the 68th percentile of global companies for overall long-term risk management.
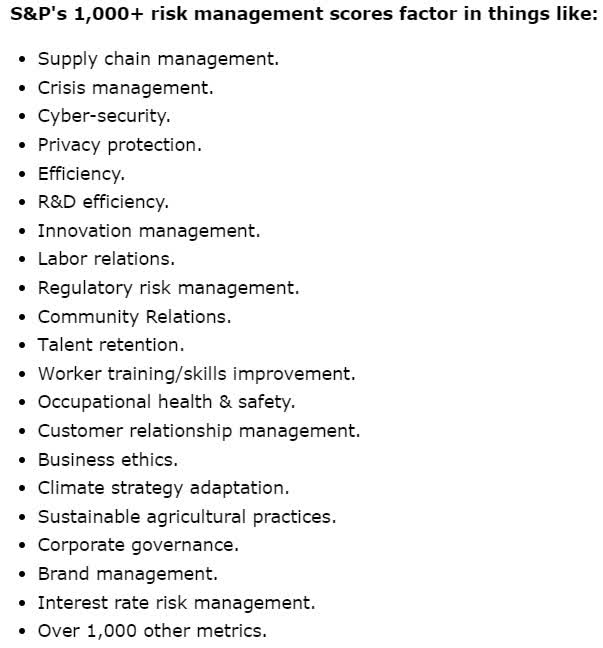
S&P
S&P’s credit ratings have included its comprehensive risk management model for about 25 years, and Fitch’s ratings have included its proprietary model for the last 35 years.
All companies must deal with everything from regulatory risk to cybersecurity, R&D productivity, and talent retention.
S&P estimates that these 10 aristocrat bargains are in the top 32% of global companies, similar to the 66th percentile that all aristocrats average.
This makes intuitive sense. A company with terrible risk management is unlikely to be able to grow its dividend for 25-plus consecutive years.
What about growth? These 10 aristocrats have an 8.9% median growth consensus. That means half of the over 250 analysts covering them for Wall Street expect faster than 8.9% growth and half slower.
Extremes can skew average growth consensus.
If Elon Musk and I were in the same room, our average net worth would be $135 billion.
The median smooths out estimates and is more accurate over time.
If you’re retired and living off the 3.8% yield, you can expect around 9% long-term income growth, at least based on the best consensus estimates from all analysts covering these companies for a living.
If you reinvest the dividends and rebalance annually, income growth will likely track total returns, a 3.8% yield + 8.9% growth or 12.7% annually.
- 10.4% consensus inflation-adjusted income growth.
- Doubling every 6.9 years.
- 178% increase in inflation-adjusted income over the next decade.
- 10.2% inflation-adjusted consensus yield on today’s cost in 2034.
The 12-month consensus fundamentally justified total return potential is 29%. That’s not a “price target” or forecast. It means that if all of these companies grow as expected and return to historical market-determined fair value, a 29% total return would be 100% justified by fundamentals.
And over the next five years, the consensus is for a 15.9% annual return potential.
- 109% consensus total return potential.
- S&P consensus is 13% annually or 84% total return potential.
However, the S&P’s total return consensus is driven primarily by a 12.3% EPS growth consensus, 2X the historical 6% growth rate.
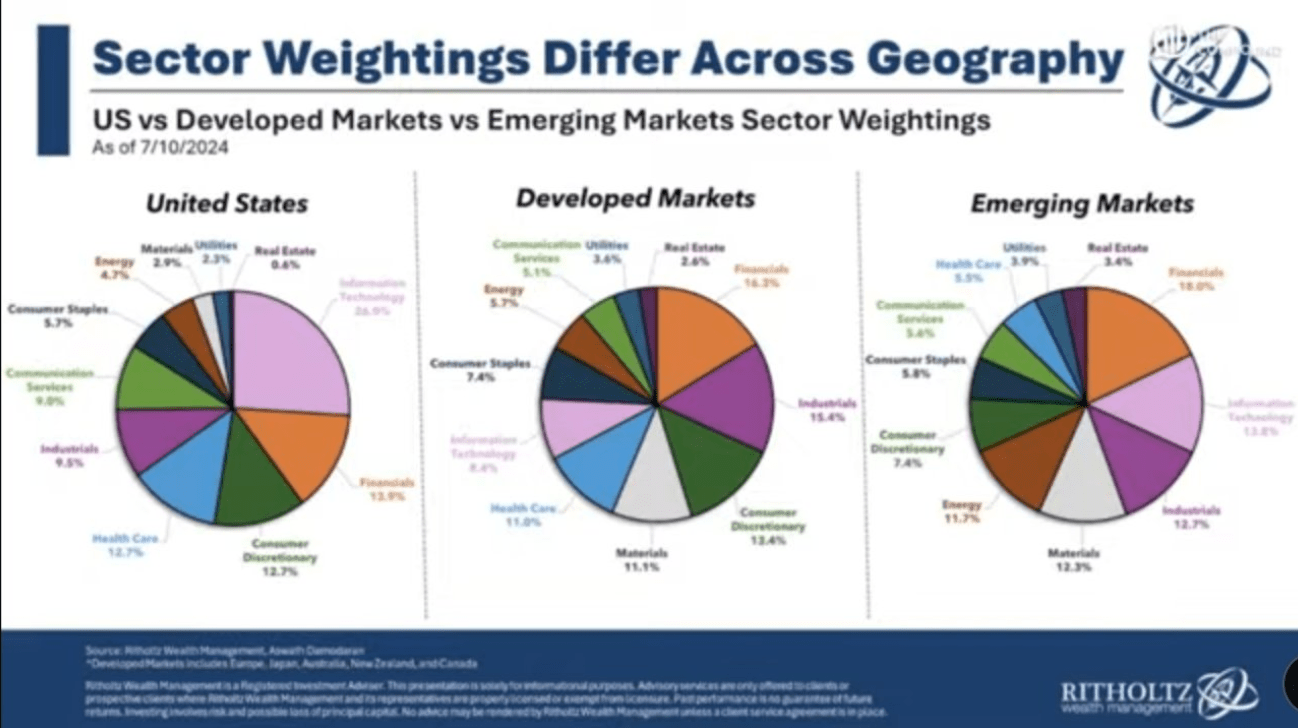
Rihtolz Wealth Management
US tech exposure is much larger than other countries, which explains why US earnings growth has been superior for the last decade.
However, yield is less speculative than growth.
What’s more likely? Can 4% yielding companies that historically grow 9% keep growing 9%?
Or can 1.3% yielding stocks that historically grow 6% to 7% grow at 12% to 13% long term?
The higher the yield, the higher the percentage of total return from income and the more predictable the returns.
Because these 4% yielding aristocrats have some of the world’s most dependable and lowest-risk dividends.
Historical Returns Since 1998
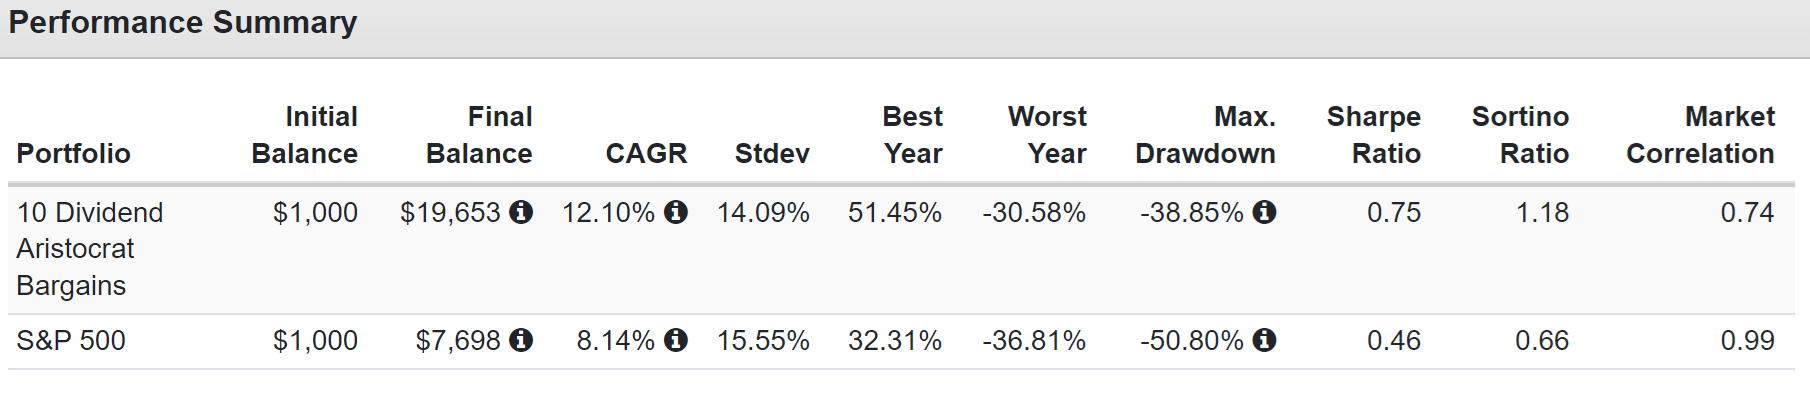
Portfolio Visualizer Premium
Over the last 26 years, these aristocrats have beaten the S&P by 50% per year (4% higher annual returns) with lower volatility and almost 2x better negative volatility-adjusted returns (Sortino ratio).
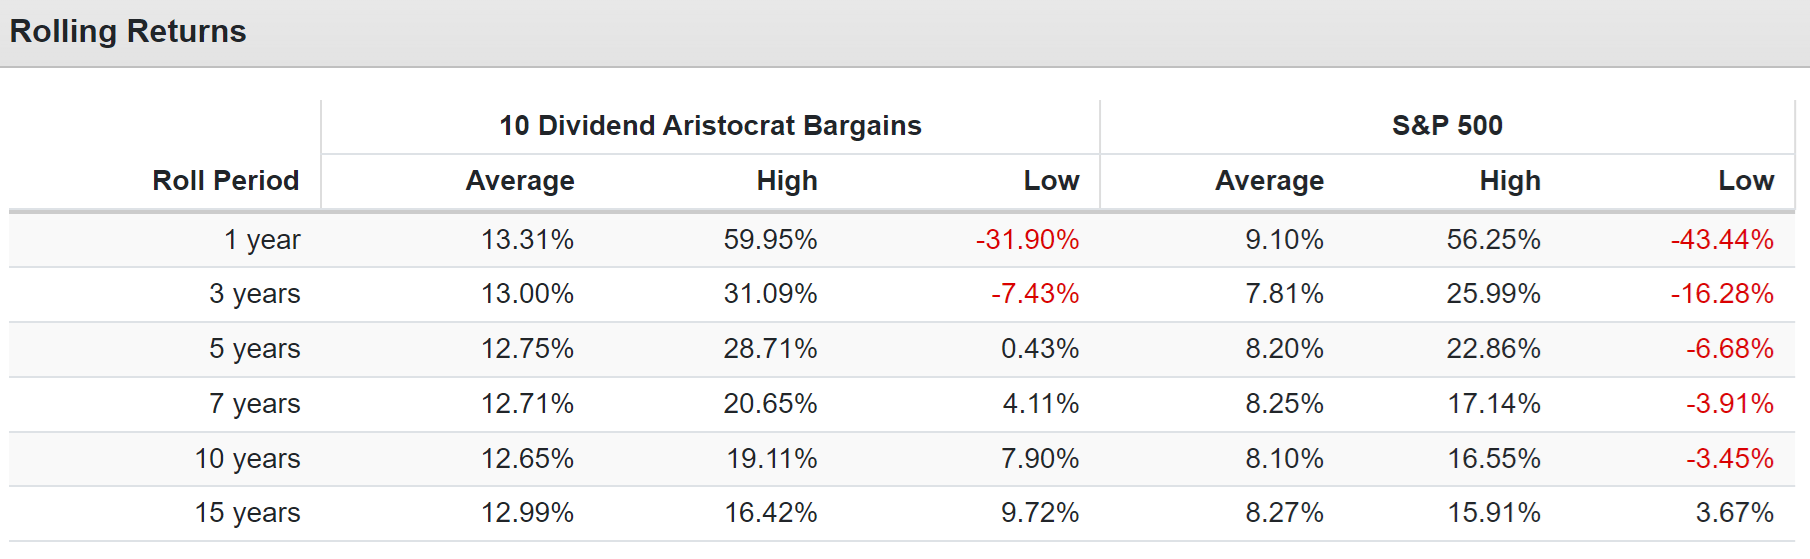
Portfolio Visualizer Premium
Consistent 13% returns over the last 26 years, with more consistent returns than the S&P.
A lost five years is much better than a lost 13 years that S&P investors had to cope with.
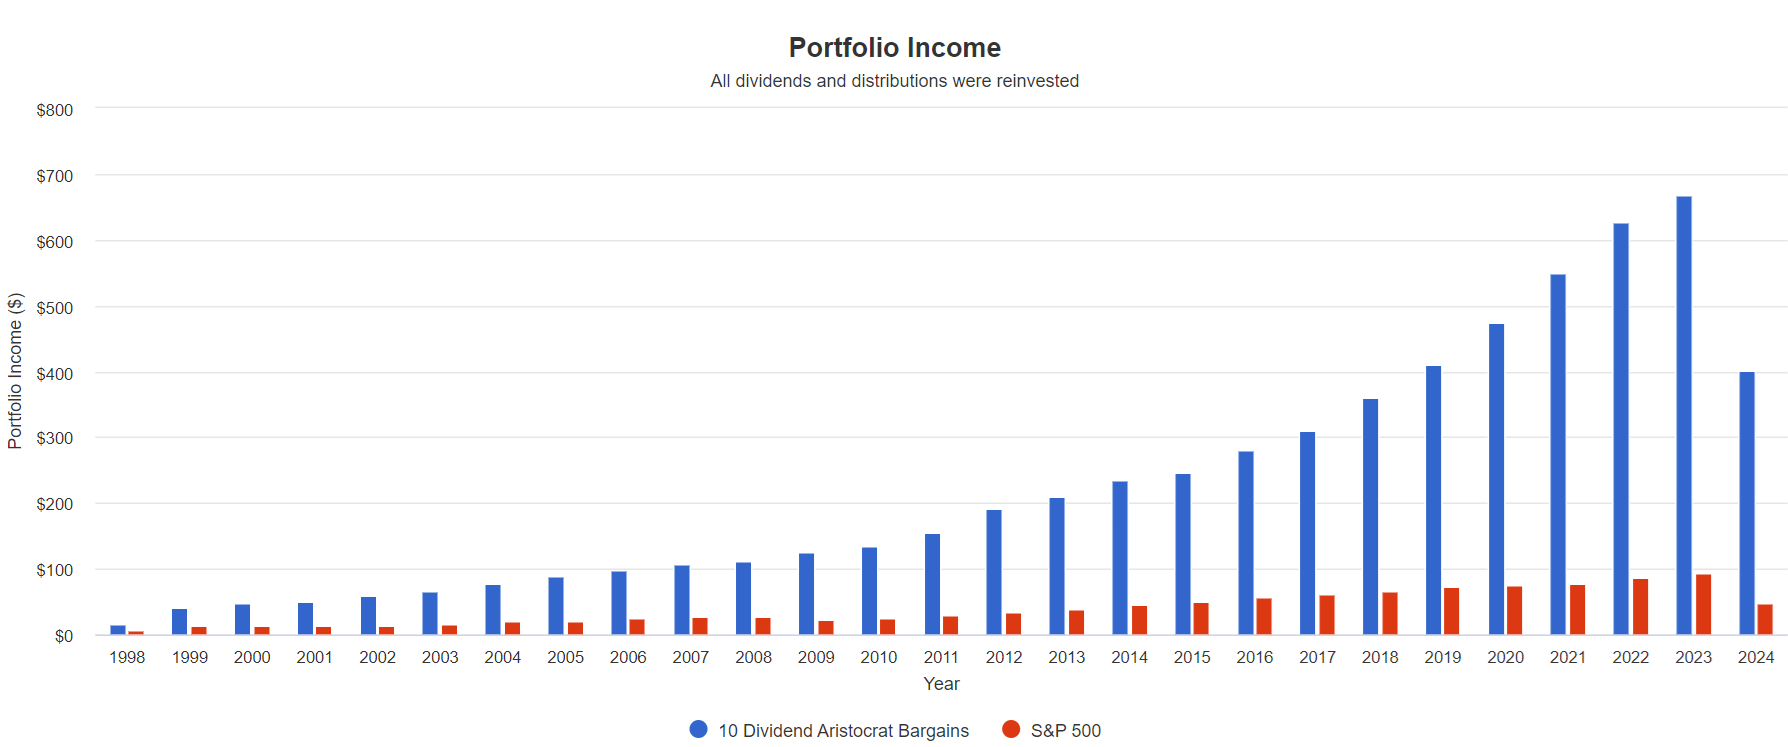
Portfolio Visualizer Premium
$1,000 Invested In 1998
| Metric | Ultra Yield Blue-Chips | S&P |
| Total Income | $6,135.22 | $1,082.81 |
| Starting Yield | 3.84% | 1.18% |
| Yield On Cost | 80.2% | 9.5% |
| Income Growth | 12.3% | 8.5% |
(Source: Portfolio Visualizer Premium)
These dividend aristocrats have delivered 6X more income than the S&P over the last 26 years, with 4% faster annual income growth.
The S&P’s new long-term income growth consensus of 13% is about the same as the aristocrats, but these aristocrats are less volatile and of higher quality than the S&P.
Also, yield is less speculative than growth since income today is more certain than potential income tomorrow.
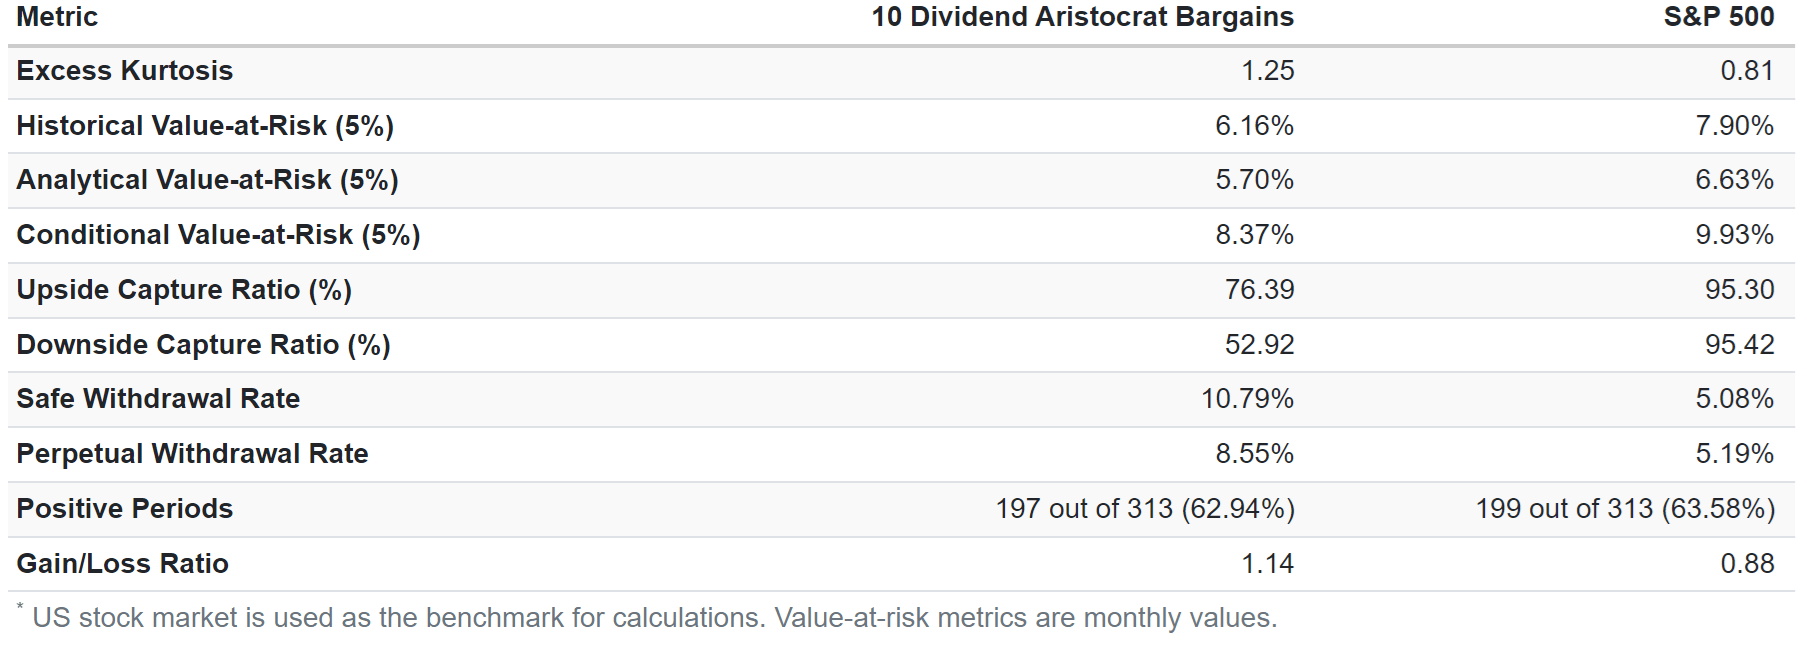
(Source: Portfolio Visualizer Premium)
These aristocrats captured 76% of the upside in rising markets and just 53% of its downside in falling markets.
That explains why they achieved 7% annual alpha, meaning outperforming their expected return by 7% per year relative to their volatility.
The safe withdrawal rate was 8.6%, about 2X higher than the 60-40 retirement portfolio and a 5.2% safe withdrawal rate for the S&P.
Consensus 2026 Total Return Potential
- Not a forecast.
- Consensus return potential.
- These are the expected returns if and only if these companies grow as expected and return to historical fair value by the end of 2026.
- Fundamentals would justify that.
Average: 73% = 20.1% annually vs 35% or 12% annually S&P.
1-Year Fundamentally Justified Upside Potential: 29% vs 13% S&P.
Diageo (DEO) 2026 Consensus Return Potential
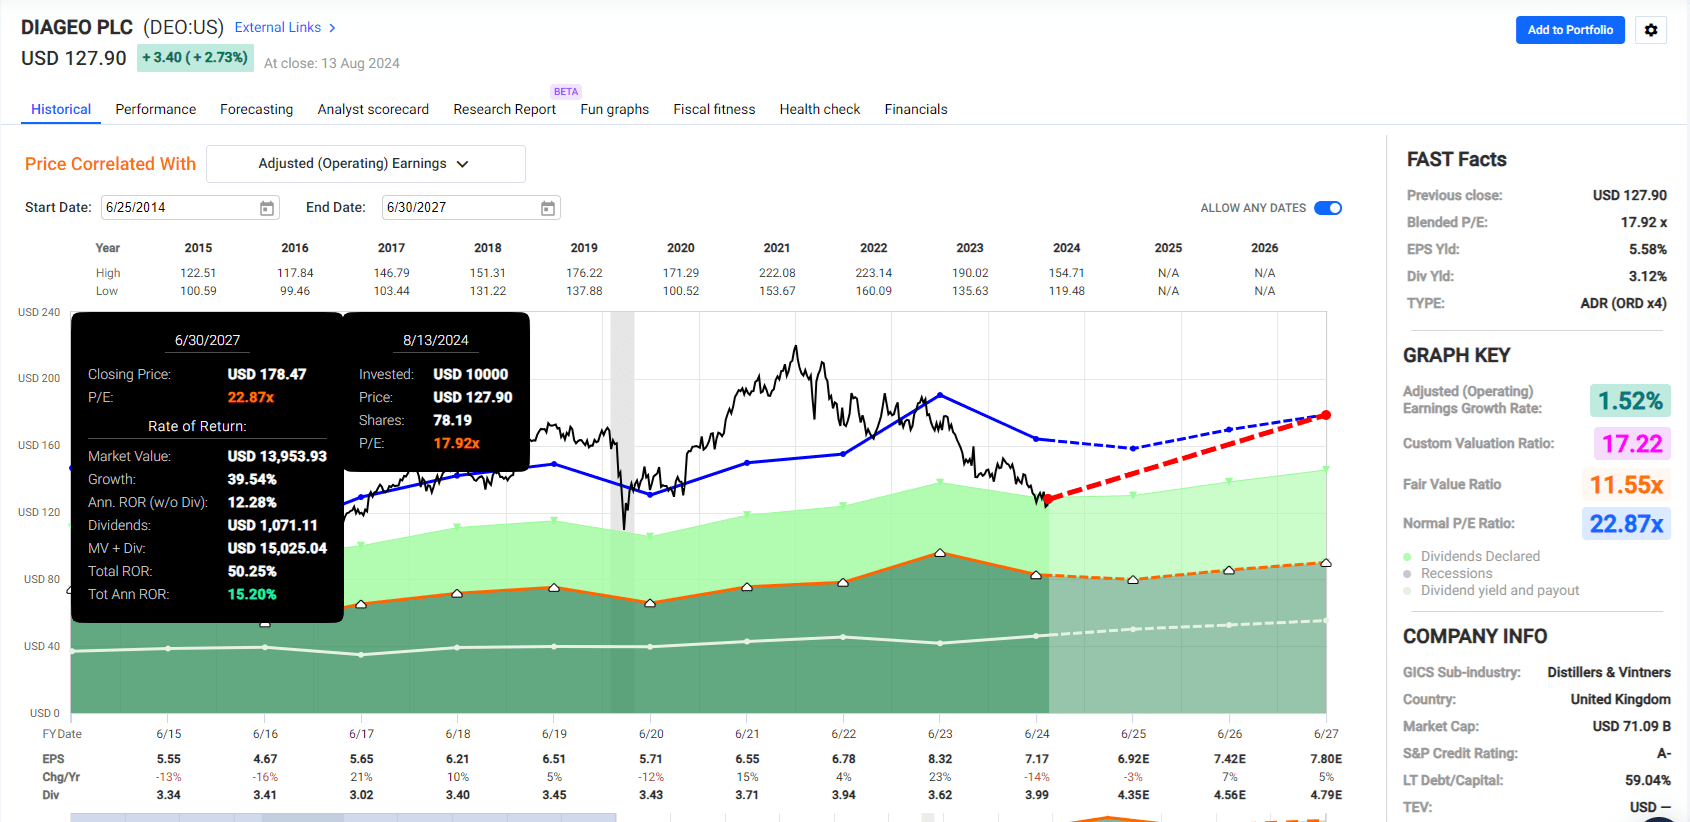
FAST Graphs, FactSet
National Fuel Gas (NFG) 2026 Consensus Return Potential
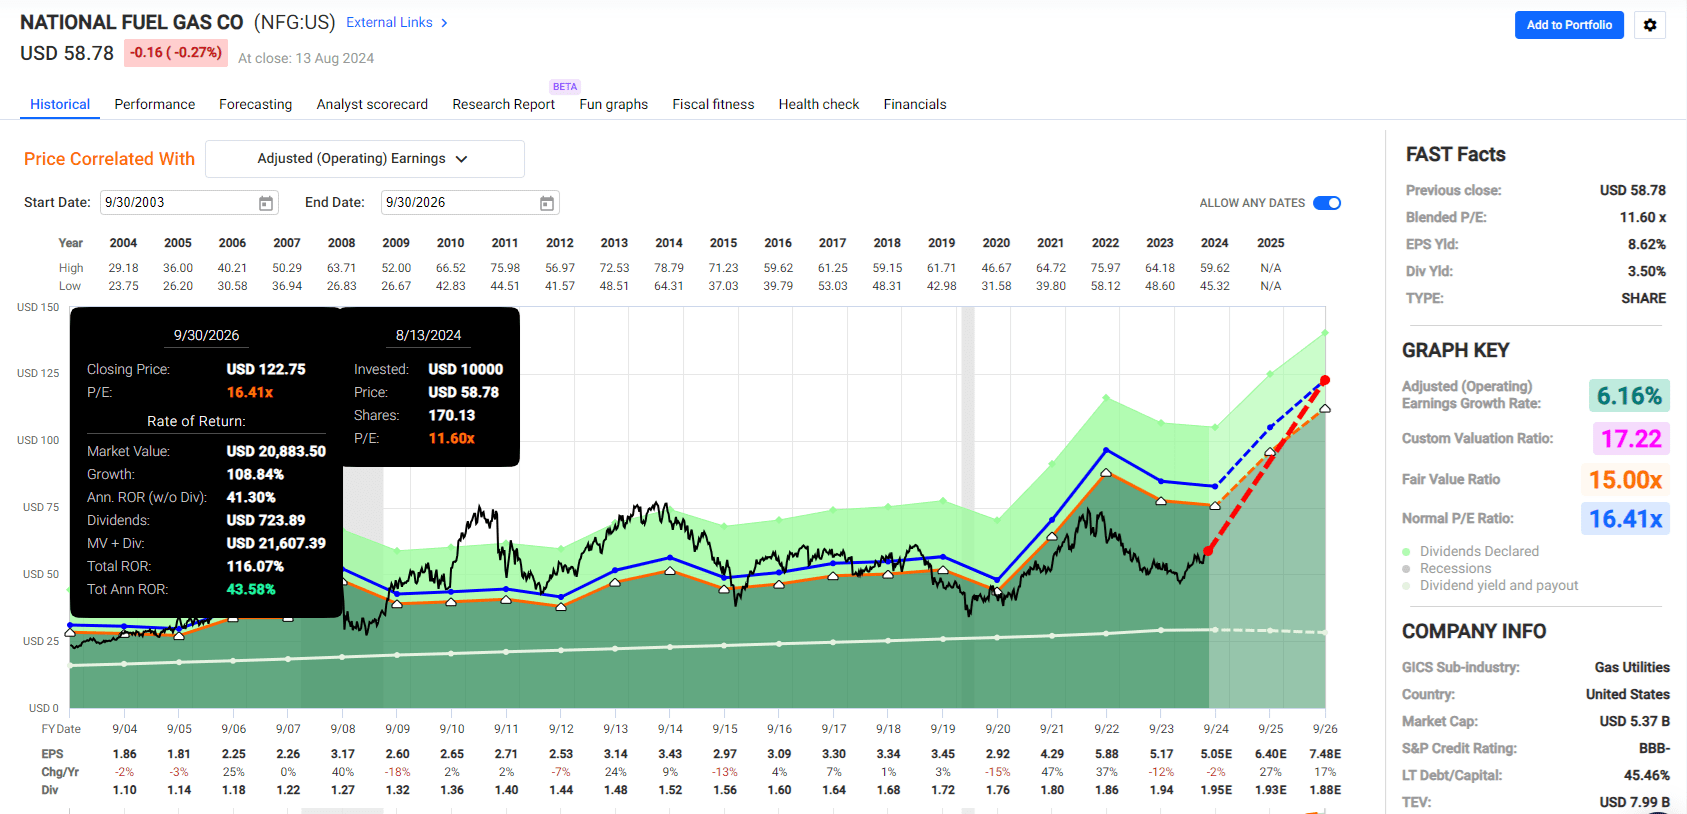
FAST Graphs, FactSet
Cullen/Frost Bankers (CFR) 2026 Consensus Return Potential
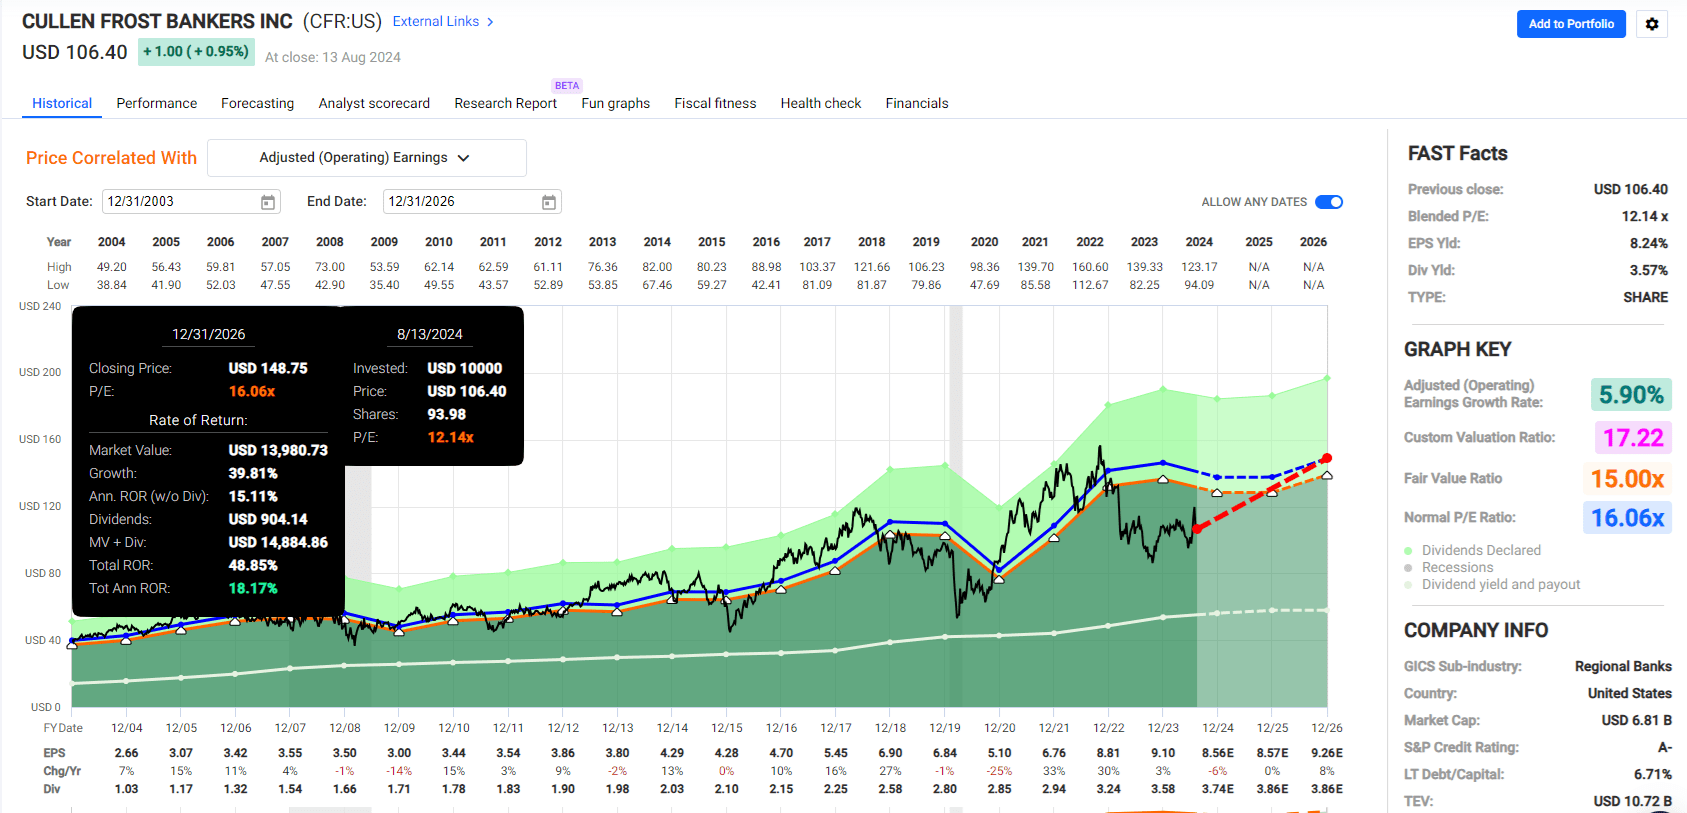
FAST Graphs, FactSet
American States Water (AWR) 2026 Consensus Return Potential

FAST Graphs, FactSet
Sysco (SYY) 2026 Consensus Return Potential
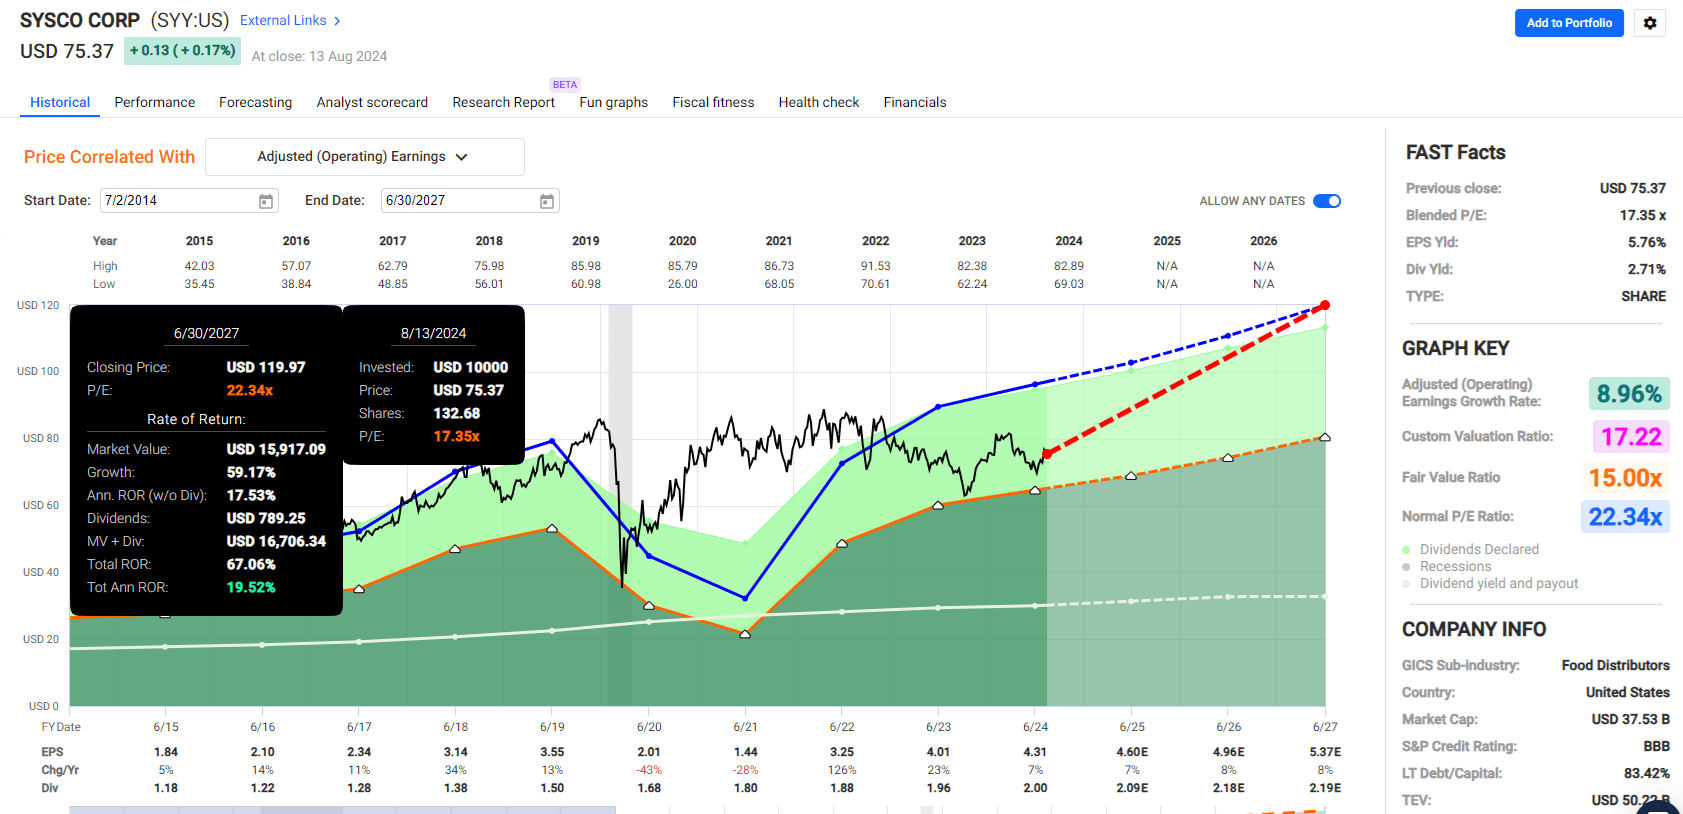
FAST Graphs, FactSet
Enterprise Products Partners (EPD) 2026 Consensus Return Potential
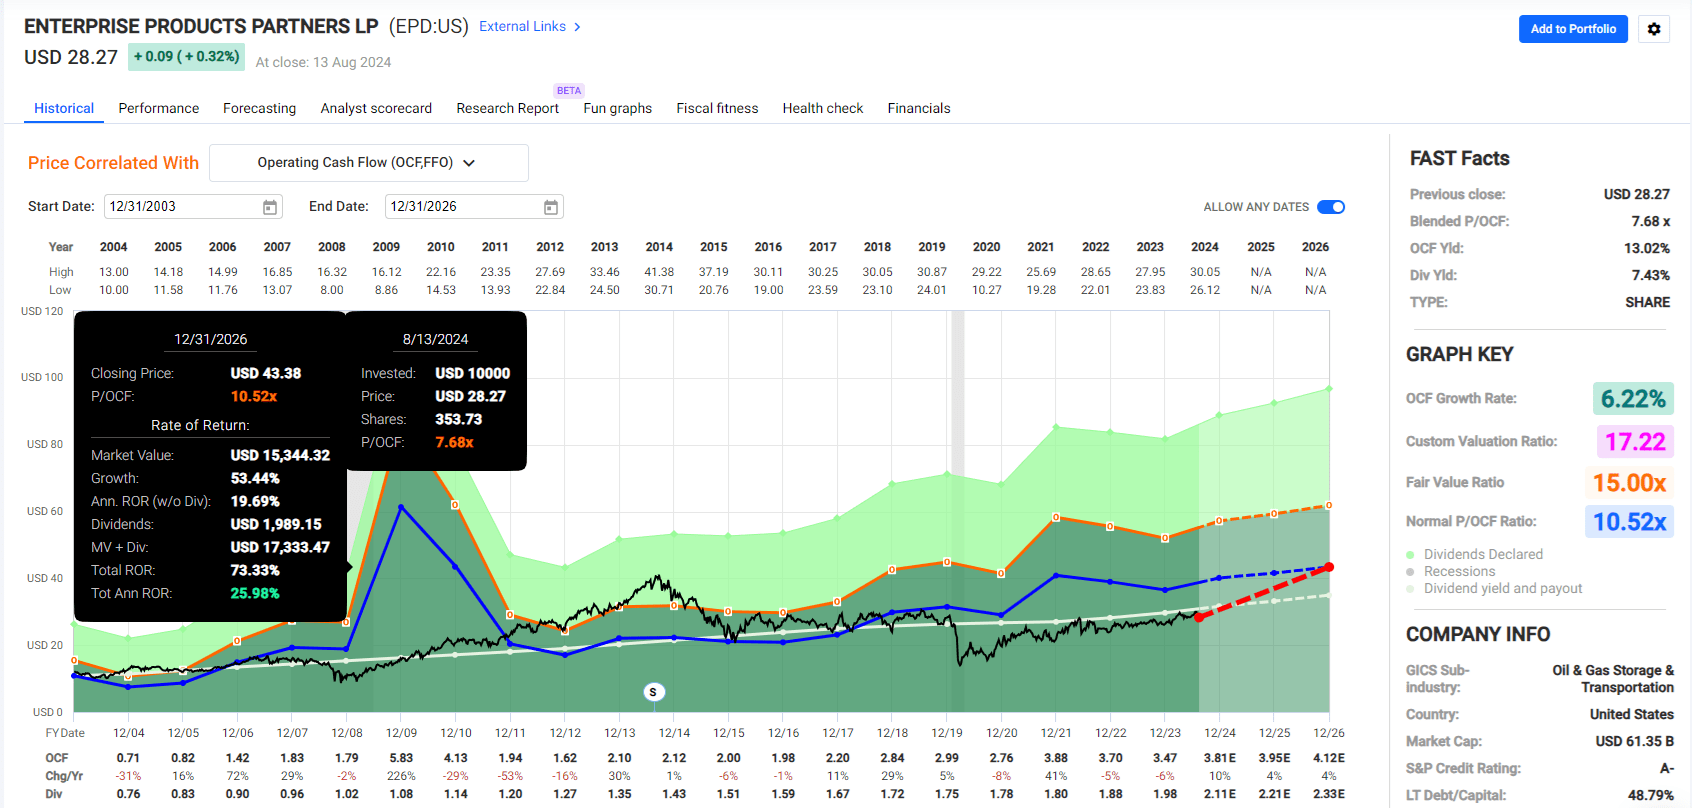
FAST Graphs, FactSet
Polaris (PII) 2026 Consensus Return Potential
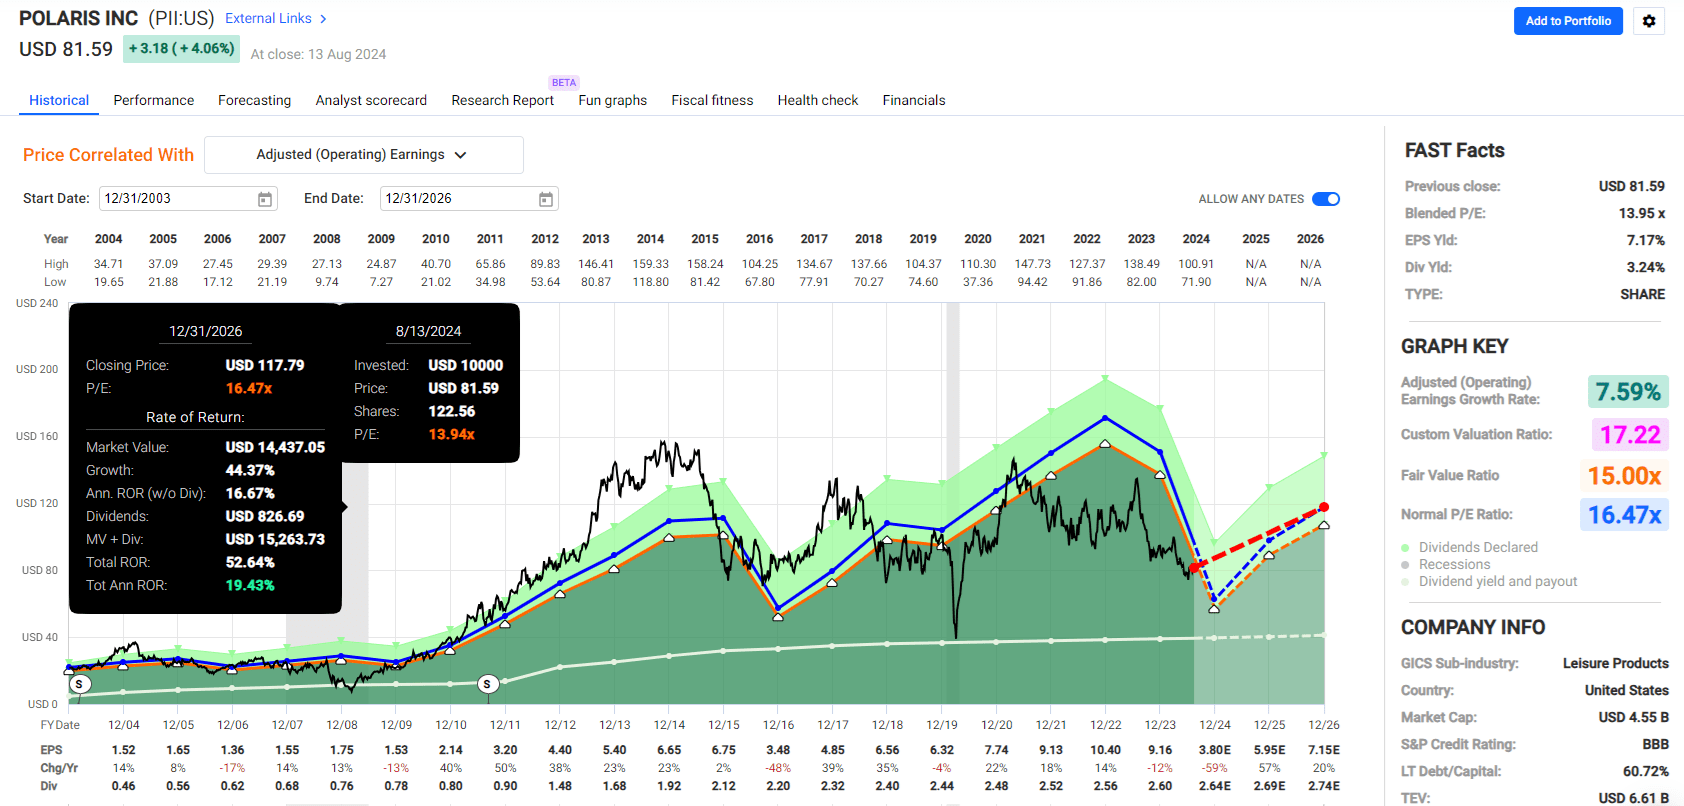
FAST Graphs, FactSet
Altria (MO) 2026 Consensus Return Potential
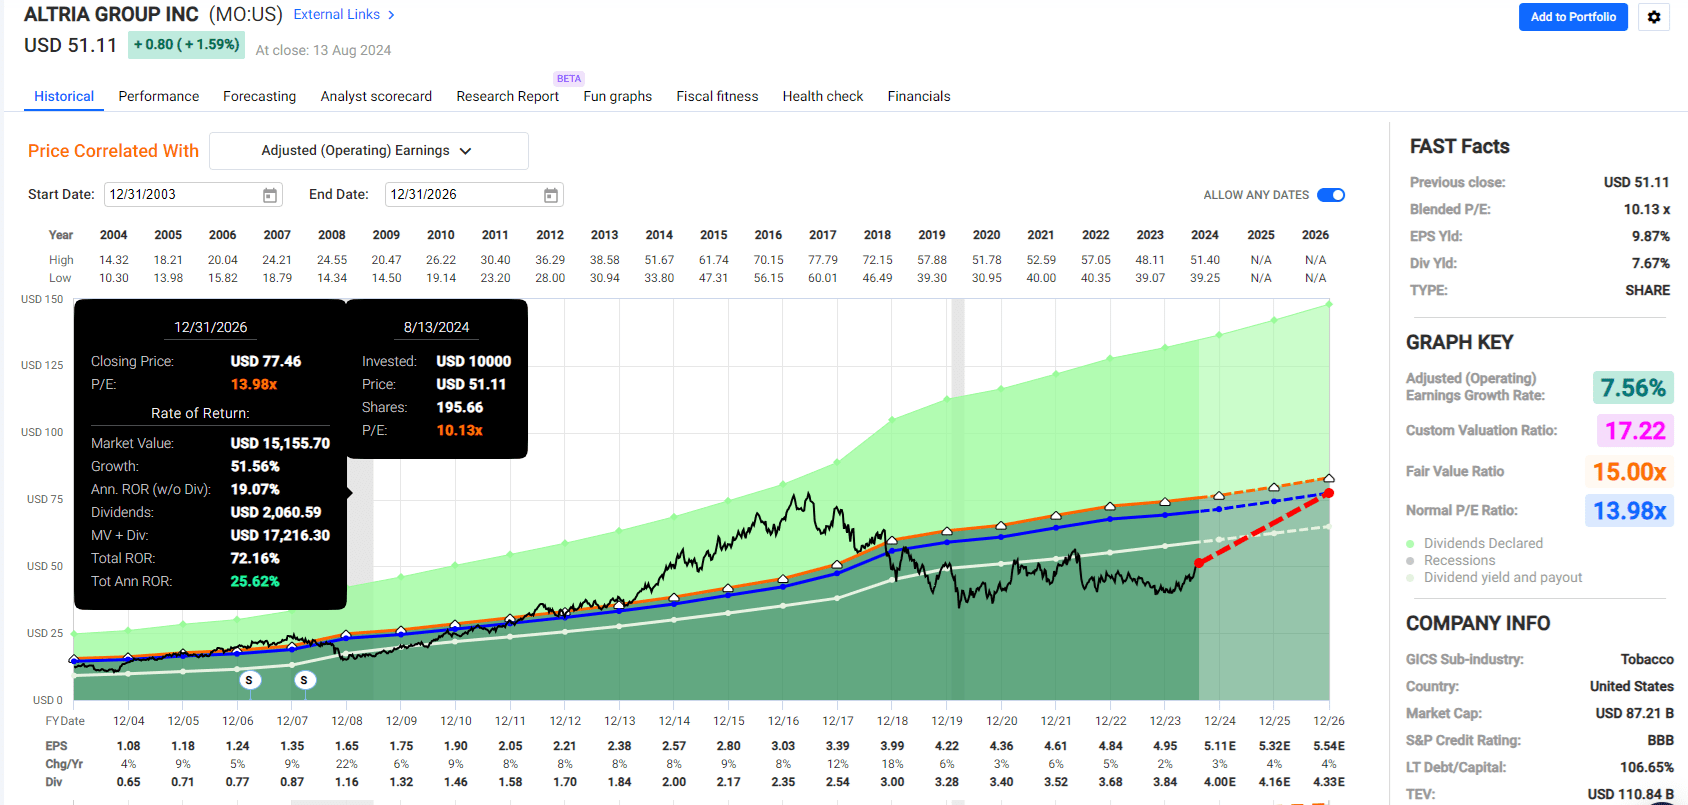
FAST Graphs, FactSet
Carlisle Industries (CSL) 2026 Consensus Return Potential
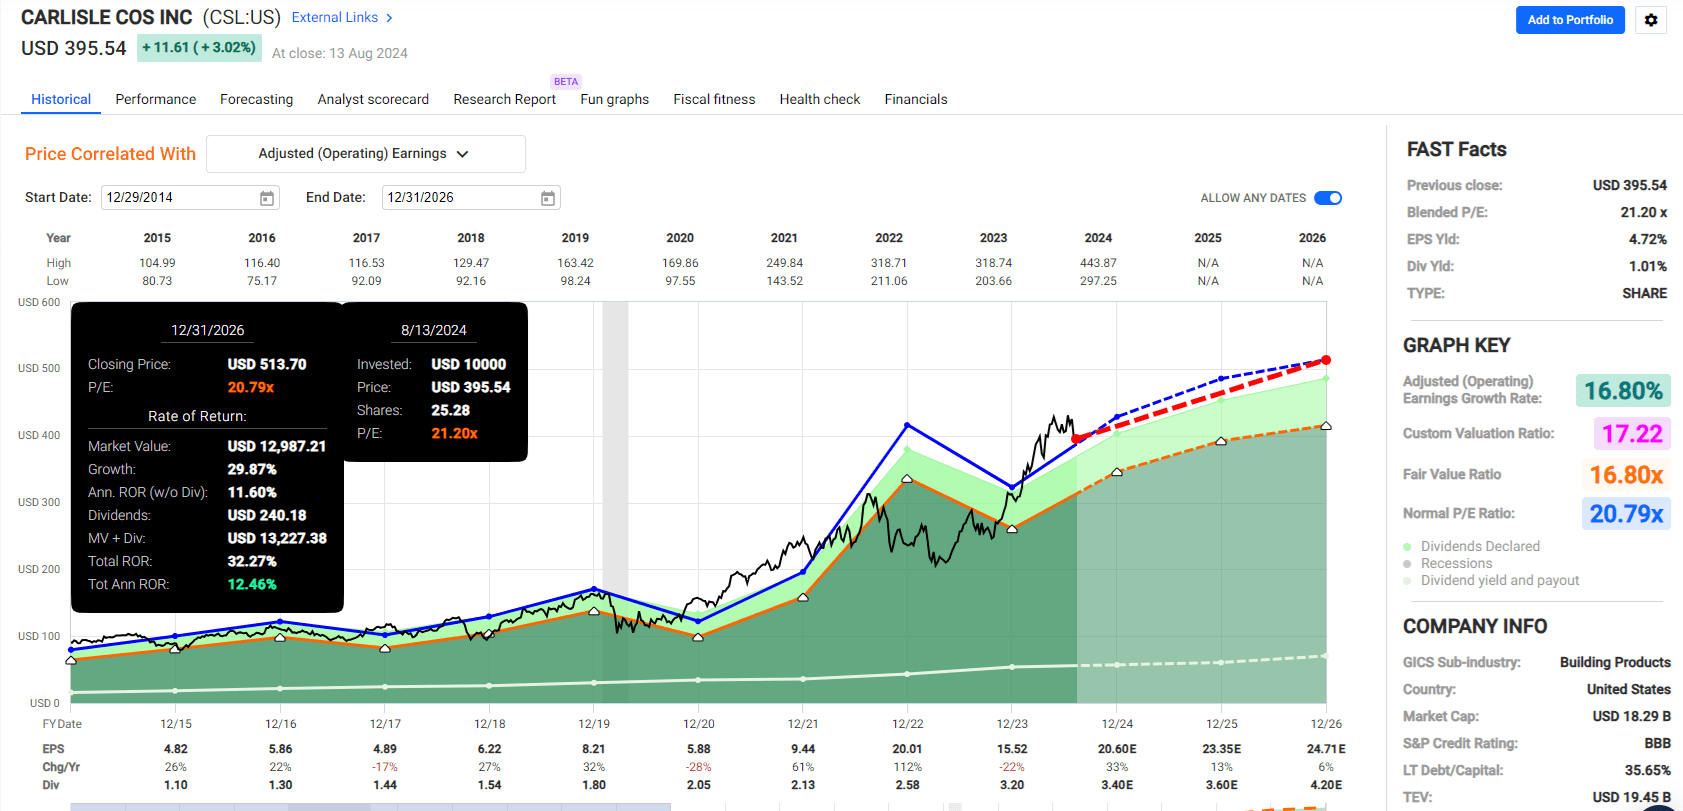
FAST Graphs, FactSet
NextEra Energy (NEE) 2026 Consensus Return Potential
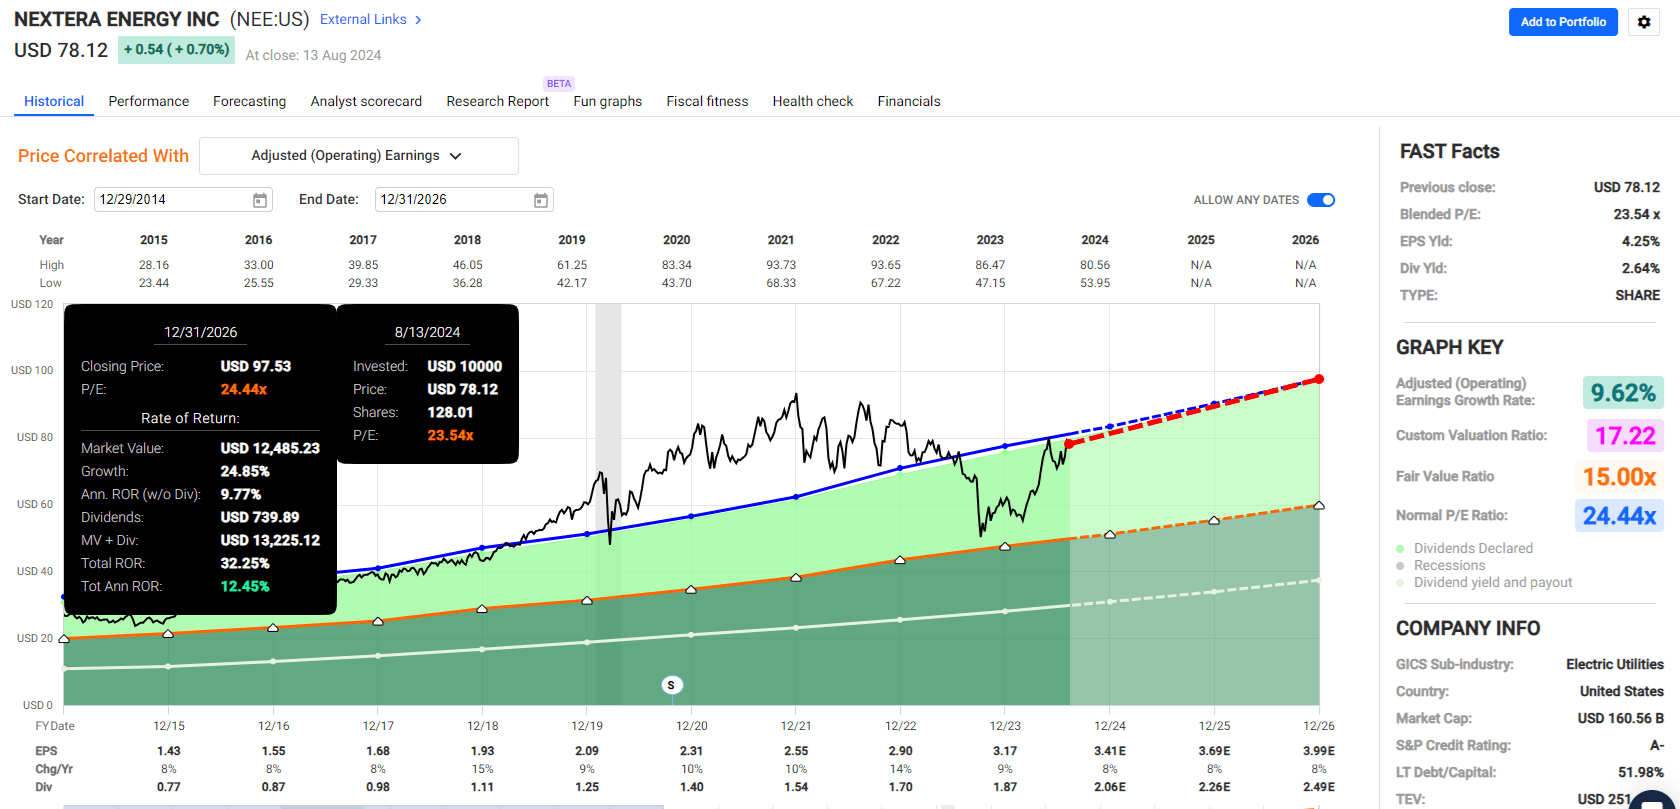
FAST Graphs, FactSet
Risks To Consider
The downside of using a consensus-based investing system is that the consensus can sometimes be wrong. Statistically, it’s 92% accurate (according to FactSet) over the last 20 years.
However, imagine the dozens of polling companies flooding us with polls.
On election day, someone will nail the final results and be more accurate than the consensus (average) of all the polls.
However, you can’t know ahead of time who will nail it. There’s always some analyst who is dead on for any given quarter’s or year’s results.
Similarly, the five-year growth rate is something that dozens of analysts will achieve; at least someone will.
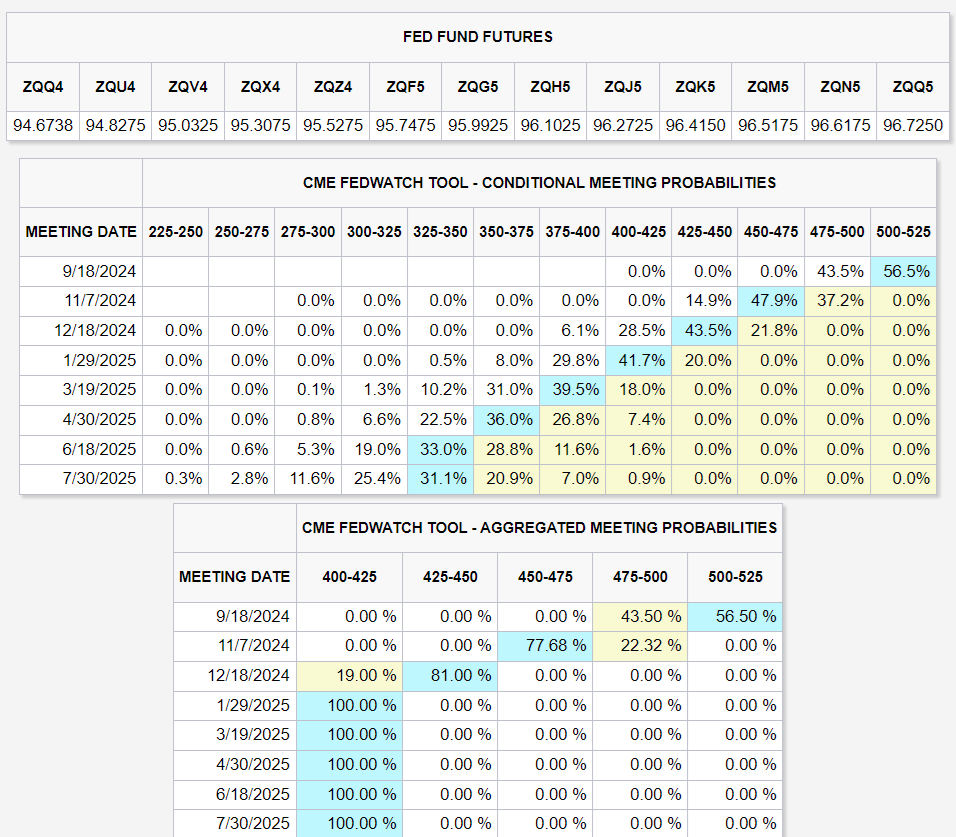
CME Group
The same is true for the bond market’s estimates for Fed rate cuts.
Within one week, the probability of a 50 basis point cut in September rose from 4% to 75% and then fell back to 22%.
These probabilities change in real time, literally every few minutes, whenever CME updates its page.
Does that mean the numbers are meaningless? Not at all. The day of the Fed meeting, whatever is an 80%-plus probability, is what the Fed has done, without fail, since 2008.
More importantly, every financial analyst tracks the CME Fed Tracker because we can know real-time probabilities of Fed monetary policy.
Why is that useful?
If the bond market is priced at 2% worth of cuts within a year, and you think the Fed won’t cut that much or will cut more, then you can make some significant profit.
If your economic model says that the Fed will cut 1% within a year and the bond market is priced at 2% rates, you can short the bond market, and if the Fed only cuts 1%, you can earn significant profits.
Using futures can magnify those gains.
And if the Fed cuts 3% due to a recession? Then you know that this is not priced in, not even close. Go long bond futures, and you can make a killing.
That is the value of knowing the consensus and probabilities.
You know what’s expected and priced into the stock.
But that doesn’t necessarily mean that you can predict what will happen; you can only predict what is most likely to happen and what the fundamentals justify.
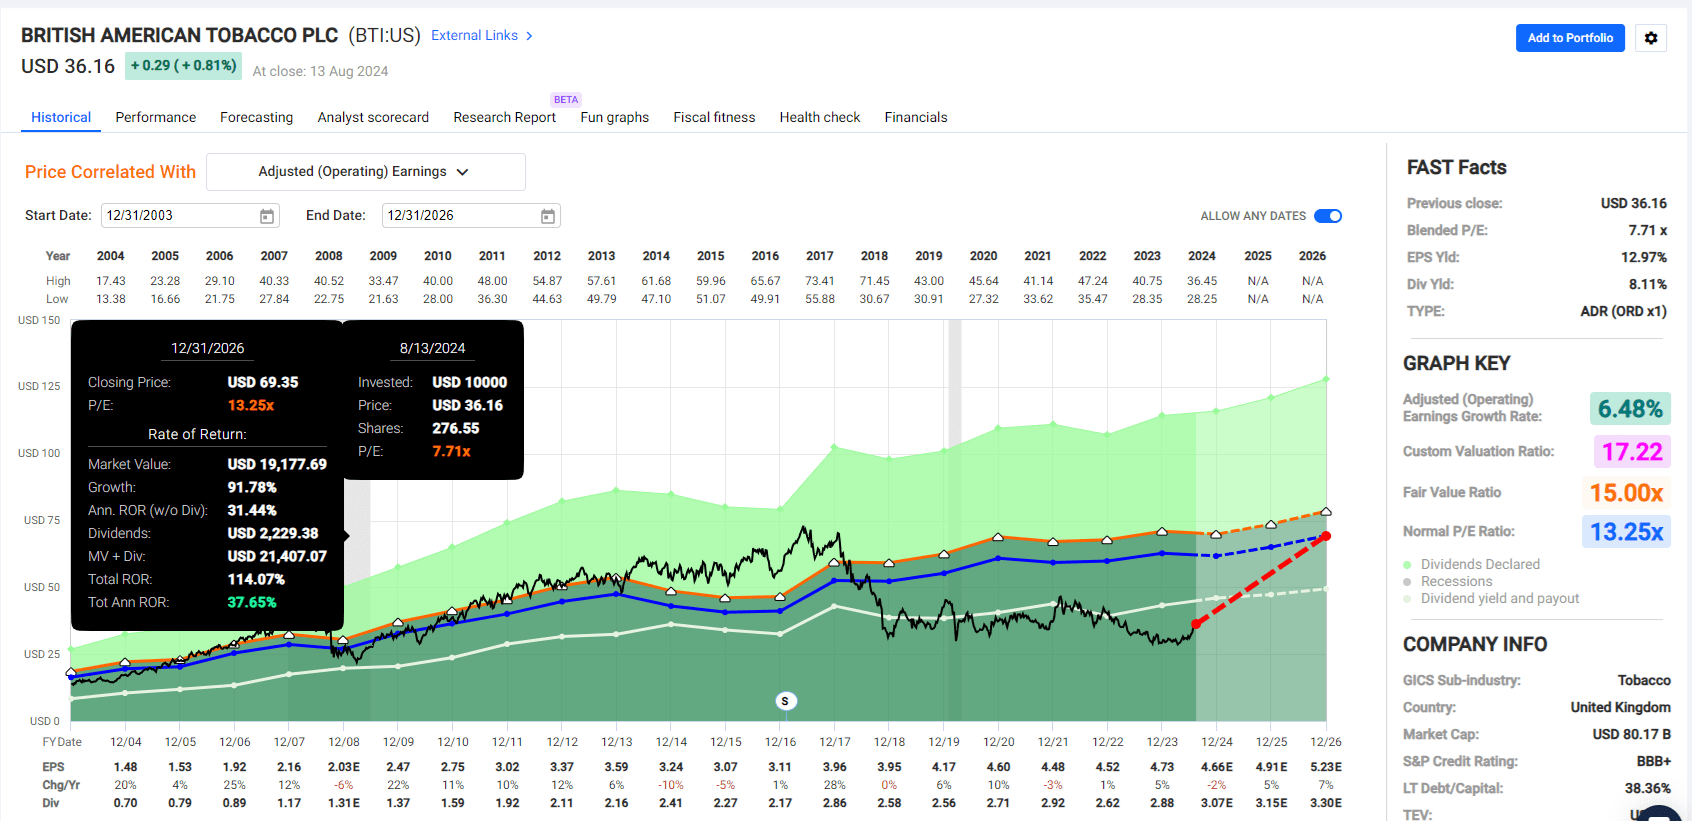
FAST Graphs, FactSet
If British America grows as expected, its EPS will be $5.23 in 2026. If it trades at its 20-year average market-determined historical fair value of 13.25 PE, it will trade at $69.35. Add in the expected dividends, and you get a 114% total return, or 38% annually.
Is this a forecast of “Dividend Sensei says BTI will be a $69.35 stock in 2026?” Nope. If BTI grows as expected and returns to historical fair value, it will trade at $69.35.
Even if BTI does grow as expected, the PE may be 10X or 15X.
BTI might even fly into a bubble and trade at a 50% historical premium like it did in 2017, which would be a PE of around 20.
Or it could grow as expected, and the price might stay flat. If that happens, the PE would fall to 7.2X, and the yield would rise to 9.2%.
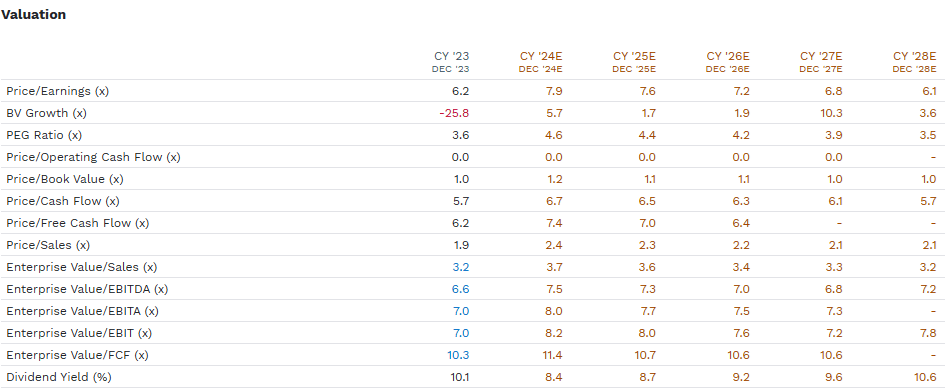
FAST Graphs, FactSet
If BTI stays flat through 2028, the PE would fall to 6.1, and the yield would hit a 30-year high of 10.6%.
Is that likely? No. Is it possible? Yes.
It’s all probability curves. I’m providing the best available consensus estimate at any given time, which is the most likely outcome. But all these ideas and recommendations are snapshots in time, not forecasts.
And guess what? Even if the most likely outcome is dead right, and these aristocrats deliver 16% annual returns over the next five years, more than doubling, the ride isn’t likely to be smooth.
S&P’s Worst 10 Months
| 10 Dividend Aristocrat Bargains | S&P 500 | ||
| Year | Month | Return | Return |
| 2008 | 10 | -12.27% | -16.52% |
| 1998 | 8 | -10.77% | -14.12% |
| 2020 | 3 | -15.71% | -12.46% |
| 2009 | 2 | -4.52% | -10.74% |
| 2002 | 9 | -7.07% | -10.49% |
| 2001 | 2 | 1.13% | -9.54% |
| 2008 | 9 | -5.07% | -9.44% |
| 2022 | 9 | -8.35% | -9.24% |
| 2018 | 12 | -6.58% | -8.79% |
| 2022 | 4 | -1.85% | -8.78% |
| Average | -7.11% | -11.01% | |
| Median | -6.83% | -10.02% |
(Source: Portfolio Visualizer Premium)
S&P’s Best 10 Months
| 10 Dividend Aristocrat Bargains | S&P 500 | ||
| Year | Month | Return | Return |
| 2020 | 4 | 10.07% | 12.70% |
| 2011 | 10 | 12.88% | 10.91% |
| 2020 | 11 | 10.97% | 10.88% |
| 2009 | 4 | 8.93% | 9.93% |
| 2000 | 3 | 9.44% | 9.69% |
| 2022 | 7 | 10.61% | 9.21% |
| 2023 | 11 | 2.86% | 9.13% |
| 2010 | 9 | 9.40% | 8.96% |
| 2015 | 10 | 4.57% | 8.51% |
| 2003 | 4 | 8.11% | 8.46% |
| Average | 8.78% | 9.84% | |
| Median | 9.42% | 9.45% |
(Source: Portfolio Visualizer Premium)
Aristocrats Worst 10 Months
| 10 Dividend Aristocrat Bargains | S&P 500 | ||
| Year | Month | Return | Return |
| 2020 | 3 | -15.71% | -12.46% |
| 2008 | 10 | -12.27% | -16.52% |
| 2020 | 2 | -11.31% | -7.92% |
| 1998 | 8 | -10.77% | -14.12% |
| 2022 | 9 | -8.35% | -9.24% |
| 2011 | 9 | -7.95% | -6.94% |
| 2001 | 9 | -7.44% | -8.16% |
| 2008 | 11 | -7.12% | -6.96% |
| 2002 | 9 | -7.07% | -10.49% |
| 2022 | 6 | -6.94% | -8.25% |
| Average | -9.49% | -10.11% | |
| Median | -8.15% | -8.75% |
(Source: Portfolio Visualizer Premium)
Aristocrats Best 10 Months
| 10 Dividend Aristocrat Bargains | S&P 500 | ||
| Year | Month | Return | Return |
| 2011 | 10 | 12.88% | 10.91% |
| 2000 | 12 | 12.21% | -0.52% |
| 2009 | 7 | 11.08% | 7.46% |
| 2020 | 11 | 10.97% | 10.88% |
| 2022 | 7 | 10.61% | 9.21% |
| 2020 | 4 | 10.07% | 12.70% |
| 2000 | 3 | 9.44% | 9.69% |
| 2010 | 9 | 9.40% | 8.96% |
| 1999 | 4 | 9.00% | 3.80% |
| 2009 | 4 | 8.93% | 9.93% |
| Average | 10.46% | 8.30% | |
| Median | 10.34% | 9.45% |
(Source: Portfolio Visualizer Premium)
These 10 aristocrats usually go up or down in any given month along with the market, to a greater or lesser degree. But sometimes, they diverge entirely and can fall when stocks rise or rise when stocks fall.
If you own a portfolio that’s very different than the S&P, you must be prepared to feel like a genius sometimes and, at other times, feel market envy and fear of missing out, or FOMO.
Remember that Ultra SWAN quality doesn’t mean “not volatile,” nor does it mean “bond alternative.” Controlling volatility to match your personal emotional risk profile depends not on stock picking but on asset allocation.
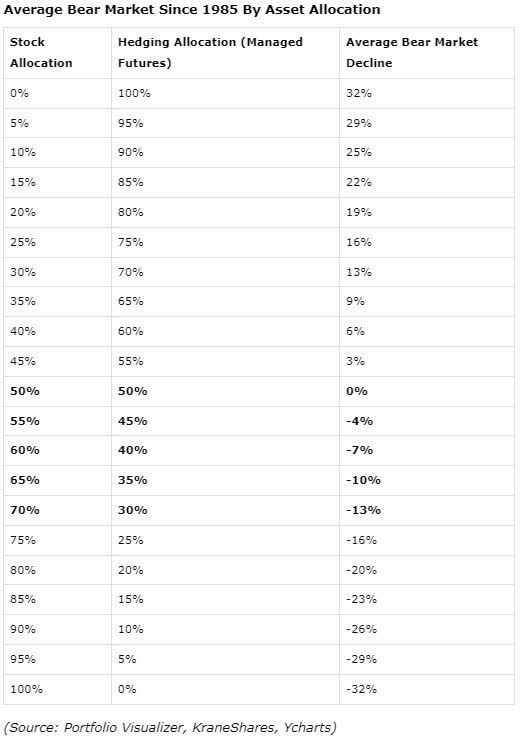
Portfolio Visualizer
Bottom Line: Aristocrat Bargains Are Always Available If You Know Where To Look
The stock market is ripping and could soon be back to record highs.
But that doesn’t mean you still can’t find amazing aristocrat bargains if you know where to look and how to separate value traps from hidden gems.
I love doing that because I’ve spent almost a decade learning how to find the most dependable blue chips and recommend them when they are likely severely mispriced.
While there are no guarantees or certainties on Wall Street, if you follow a disciplined and prudent strategy for long enough, focusing on safety and quality first, prudent valuation, and sound risk management, you can always push the probability of financial success to 97.5%.