Fundamental
Overview
The Nasdaq finally erased the entire drop from the last ISM
Manufacturing PMI as the market faded the “growth scare”. The first catalyst
was the good US
Jobless Claims on the 8th of August as that quelled the fears on
a deteriorating labour market triggered by the weak NFP
report.
Last week, we got even better Jobless
Claims figures and a great Retail
Sales report which increased the bullish momentum. The market’s focus is
now clearly on growth. This week, we will have two key events.
The first will be on Thursday as we will get the release of the US Flash
PMIs for August and that will be kind of a test for the thesis that the July
data was negatively affected by Hurricane Beryl. The second one will be Fed
Chair Powell’s speech at the Jackson Hole Symposium where he will likely
pre-commit to a rate cut in September.
Nasdaq
Technical Analysis – Daily Timeframe
Nasdaq Daily
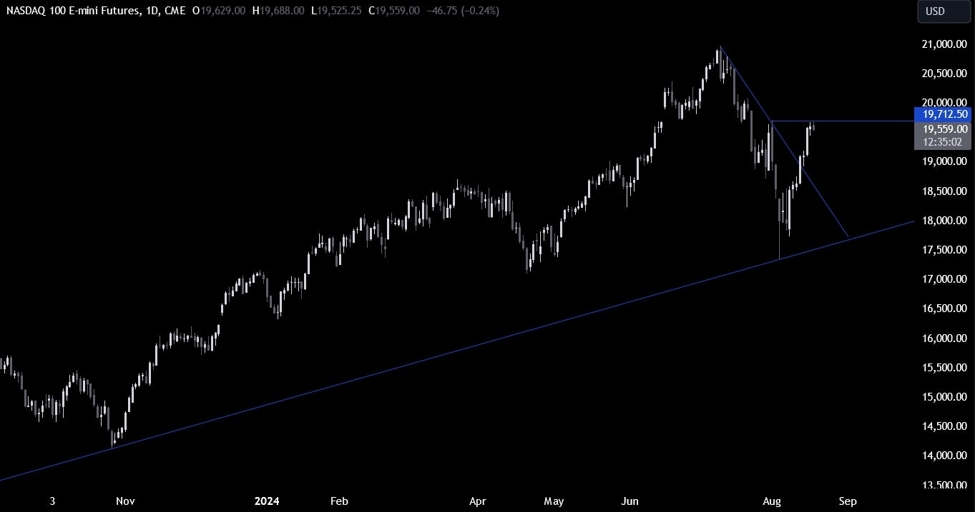
On the daily chart, we can
see that the Nasdaq broke above the key trendline and extended the gains into the key
19712 level. This is where we can expect the sellers to step in with a defined
risk above the level to position for a drop into the major trendline around the
18000 level. The buyers, on the other hand, will want to see the price breaking
higher to increase the bullish bets into new highs.
Nasdaq Technical
Analysis – 4 hour Timeframe
Nasdaq 4 hour
On the 4 hour chart, we can
see that we an upward trendline defining the current bullish momentum. If we
were to get a bigger pullback, the buyers will likely lean on the trendline
where they will also find the 38.2% Fibonacci
retracement level for confluence.
The sellers, on the other hand, will want to see the price breaking lower to
increase the bearish bets into the 18000 level.
Nasdaq Technical
Analysis – 1 hour Timeframe
Nasdaq 1 hour
On the 1 hour chart, we can
see that we have a steeper minor upward trendline that’s been acting as support
for the buyers as they kept on leaning on it to push into higher highs. This is
where we will likely see them stepping in again with a defined risk below the
last higher low at 19445 to position for a break above the key resistance.
The sellers, on the other
hand, will want to see the price breaking below the trendline and the 19445
level to increase the bearish bets into the other trendline around the 19000
level. The red lines define the average daily range for today.
Upcoming Catalysts
Today we have Fed’s Waller speaking. On Thursday we get the US Jobless Claims
figures and the US PMIs. On Friday we conclude with Fed Chair Powell speaking
at the Jackson Hole Symposium.