Fundamental
Overview
The S&P 500 finally erased the entire drop from the last ISM Manufacturing PMI as the market faded the
“growth scare”. The first catalyst was the good US Jobless Claims on the 8th of
August as that quelled the fears on a deteriorating labour market triggered by
the weak NFP report.
Last week, we got even better Jobless Claims figures and a great Retail Sales report which increased
the bullish momentum. The market’s focus is now clearly on growth. This week,
we will have two key events.
The first will be on Thursday as we will get the release of the US Flash
PMIs for August and that will be kind of a test for the thesis that the July
data was negatively affected by Hurricane Beryl. The second one will be Fed
Chair Powell’s speech at the Jackson Hole Symposium where he will likely
pre-commit to a rate cut in September.
S&P 500
Technical Analysis – Daily Timeframe
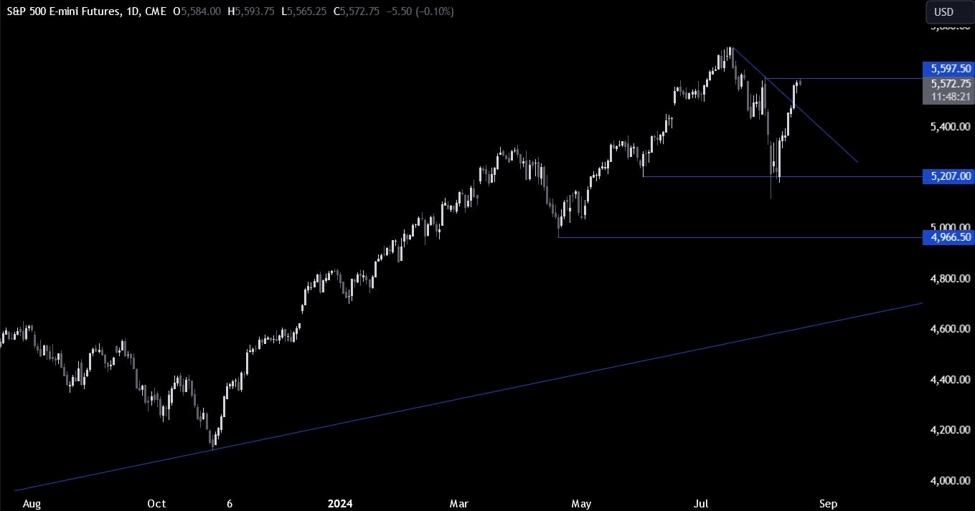
S&P 500 Daily
On the daily chart, we can
see that the S&P 500 reached the key 5600 level where the growth scare
began. This is where we can expect the sellers to step in with a defined risk
above the level to position for a drop back into the 5200 level. The buyers, on
the other hand, will want to see the price breaking higher to increase the
bullish bets into a new all-time high.
S&P 500 Technical
Analysis – 4 hour Timeframe
S&P 500 4 hour
On the 4 hour chart, we can
see that we have a key support zone around the 5440 level where we can find
the confluence
of the 38.2% Fibonacci
retracement level and the upward trendline.
If we were to get a bigger pullback, the buyers will likely step in around that
zone to position for a rally into new highs with a better risk to reward setup.
The sellers, on the other hand, will want to see the price breaking lower to
increase the bearish bets into the 5200 level.
S&P 500 Technical
Analysis – 1 hour Timeframe
S&P 500 1 hour
On the 1 hour chart, we can
see that we have a minor upward trendline defining the current bullish momentum.
The buyers leant on this trendline on several occasions as they kept on
targeting new highs. We can expect them to keep doing so, but if the price were
to break lower and fall below the last higher low at 5535, the bearish momentum
might increase as the sellers will pile in more aggressively for a drop into
the 5440 support. The red lines define the average daily range for today.
Upcoming
Catalysts
Today we have Fed’s Waller speaking. On Thursday we get the US Jobless Claims
figures and the US PMIs. On Friday we conclude with Fed Chair Powell speaking
at the Jackson Hole Symposium.