Bitcoin has just broken past the critical $60,000 mark, relieving investors and analysts concerned that losing this level might signal the end of the bull run. The market’s uncertainty is palpable, with some fearing that this $60,000 level retake is only a bull trap and the rally has run its course.
However, fresh data from CryptoQuant suggests that the bull run may be far from over. The data indicates that despite the recent dip, Bitcoin could still be on track for further gains.
Rising Bitcoin IFP Signals Renewed Bullish Momentum
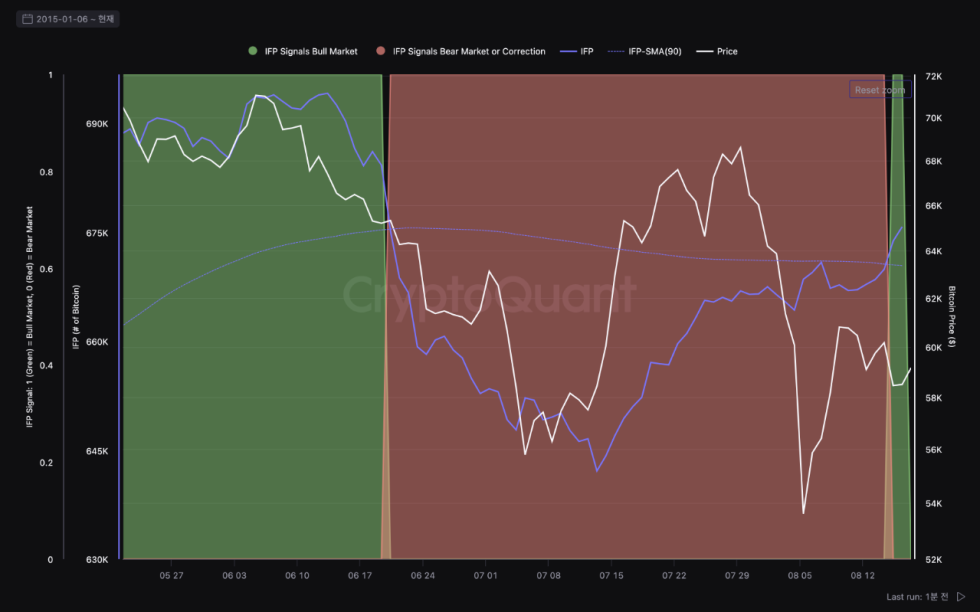
CryptoQuant recently shared data on X that highlights a significant shift in investor behavior, suggesting we may enter a new bullish phase. Their charts focus on the Bitcoin Inter-exchange Flow Pulse (IFP), a key metric that measures Bitcoin flows between spot and derivative exchanges. This metric is crucial for understanding market trends and investor sentiment.
A rising IFP typically signals a bullish phase, as it indicates that more Bitcoin is being moved into derivative exchanges, suggesting that traders are preparing for higher prices. Conversely, a falling IFP is often seen as a bearish signal, as it shows Bitcoin moving out of derivative exchanges, reflecting a more cautious or pessimistic market sentiment.
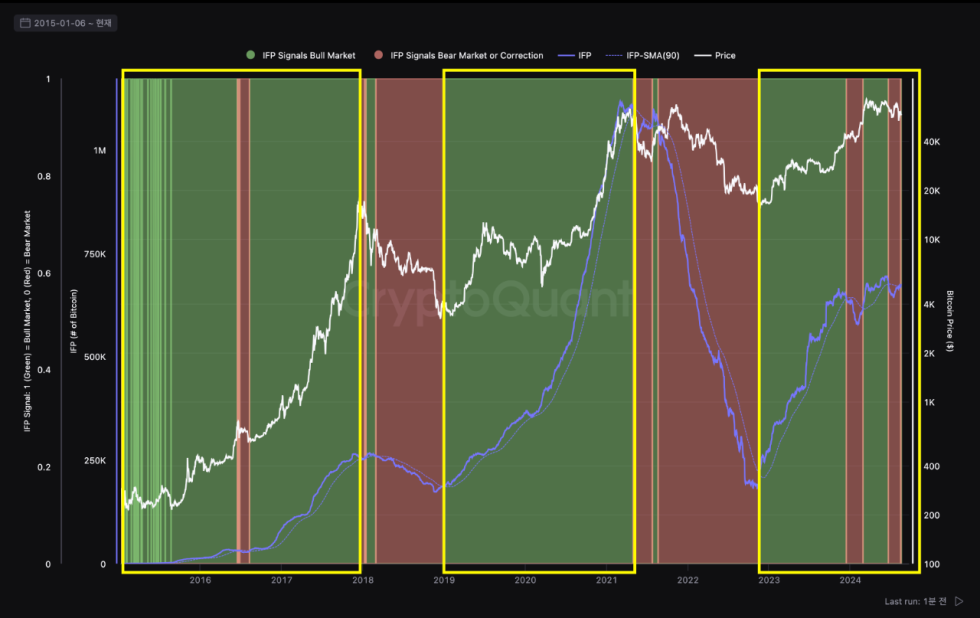
The IFP data reveals that Bitcoin flows are now rising, indicating that more Bitcoin is moving into derivative exchanges. This trend is generally considered a sign of a bullish phase, as traders typically shift funds into derivatives when they anticipate rising prices. The rising IFP suggests that investors are starting to take risks, mirroring behaviors seen in past bull markets.
Bitcoin $60,000 Level Is Crucial For Bulls
Bitcoin is currently trading at $60,495, a critical juncture that could determine its near-term trajectory. Bitcoin must maintain this level and break past the next local resistance at $62,729 to sustain upward momentum.
This price is particularly important because it aligns with the daily 200-moving average, a widely watched indicator of market strength currently at $62,842. A close above this moving average would signal renewed bullish momentum and likely pave the way for further gains.

However, losing the $60,000 level would be a cause for concern. This psychological threshold has significant importance, and a dip below it could dampen market sentiment, potentially leading to increased selling pressure.
Volatility and uncertainty continue to impact Bitcoin’s price action, making it a challenging environment for traders. Despite these fluctuations, many investors and analysts remain confident that prices will eventually head higher, driven by strong market fundamentals and growing institutional interest.
Cover image from Dall-E, Charts from Tradingview