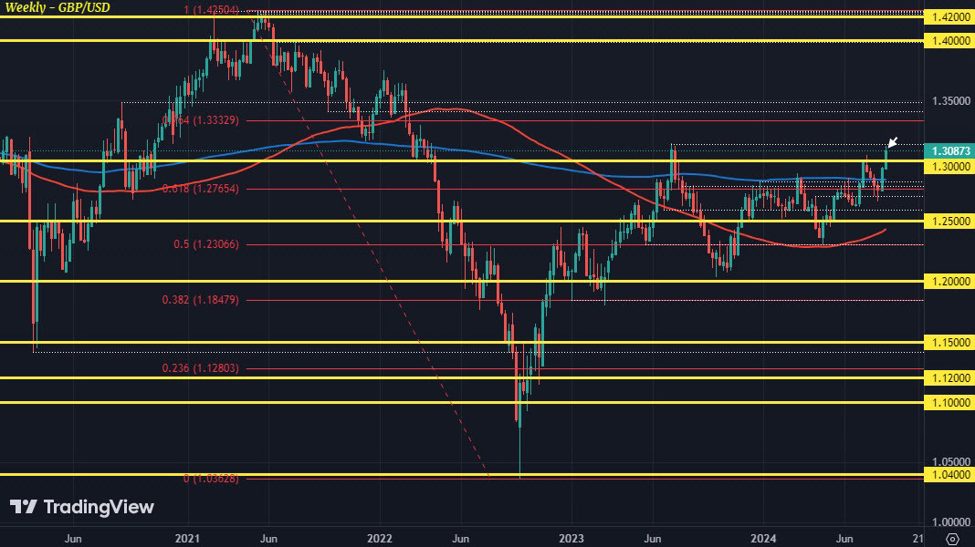
The push higher yesterday sees the pair break its high for the year and solidifies a firm break above the 1.3000 mark this week. That now brings into focus the 2023 high as cable goes in search of a potential breakout to its highest since 2022.
GBP/USD weekly chart
The music sheet in the chart above is reminiscent of what we’re seeing in EUR/USD here.
GBP/USD had previously lingered at levels in between its 100 (red line) and 200-week (blue line) moving averages this year before a pop back above 1.3000 last month. That failed to hold but buyers are finding renewed vigour as the dollar is seen struggling in the last two weeks.
That now brings in the 2023 high around 1.3142 into focus. If buyers can seal a break above that, there will be much breathing room for GBP/USD towards the upside next.
The key thing to note now is that all of this is coming off the back of markets anticipating a much more dovish Fed. They are convinced the inflation monster has been tamed in the US and worries are now turning towards the labour market instead.
Unlike with the BOE, there are still questions surrounding even a rate cut for September. And that divergence is what is pinning the dollar down across the board.
It’s not so much how aligned major central banks are about cutting rates. It’s all about the pace of the moves now.
And if the dollar stays under pressure as such, a technical break in GBP/USD alongside other dollar pairs will pile on the misery on the greenback from these last two weeks.