
Bitcoin (BTC) is currently trading below the crucial $60,000 level, with the market gripped by severe uncertainty and volatility. Investors are closely watching for signs of a potential breakout as BTC hovers near this critical threshold.
Despite the unease, key data from CryptoQuant suggests that BTC may be on the brink of a significant bullish surge. A historically accurate indicator has emerged, indicating an upcoming rise in Bitcoin prices. As the market navigates this turbulent period, this data could be the signal that investors have been waiting for, hinting at a possible shift in momentum and a return to bullish territory.
Stablecoins New High Suggests Possible Bitcoin Breakout
CryptoQuant data reveals that the total market cap of stablecoins has reached an all-time high of $165 billion, marking the highest level ever recorded. This surge in the stablecoins market cap is particularly significant because it often precedes a rise in Bitcoin and altcoin prices.
When stablecoins’ market caps begin to climb, it typically signals an influx of liquidity into the crypto market, setting the stage for a potential bullish scenario.
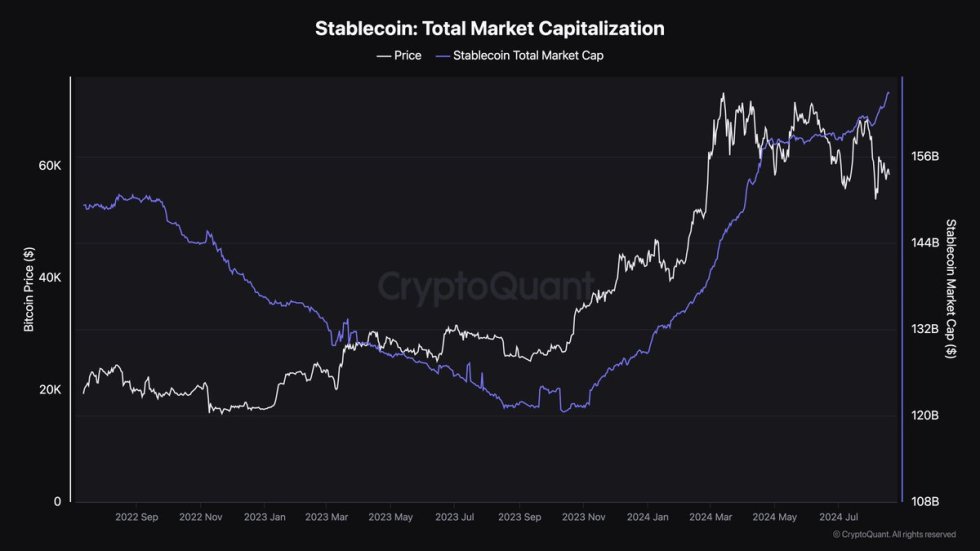
This indicator is especially relevant when the stablecoins market cap consolidates, as it has over the past few months, and then starts to grow.
Such growth has historically been a precursor to upward movements in Bitcoin and other cryptocurrencies. A similar pattern occurred between September and November last year when the stablecoins market cap consolidated around $120 billion. As it began to break out, Bitcoin prices followed suit, leading to a significant uptrend across the crypto market.
Given the current record high in stablecoins’ market cap, we could be on the brink of another significant bullish phase. The growing market cap suggests that more capital is ready to flow into the broader crypto ecosystem, potentially driving prices higher in the coming weeks.
BTC Consolidation Before The Uptrend
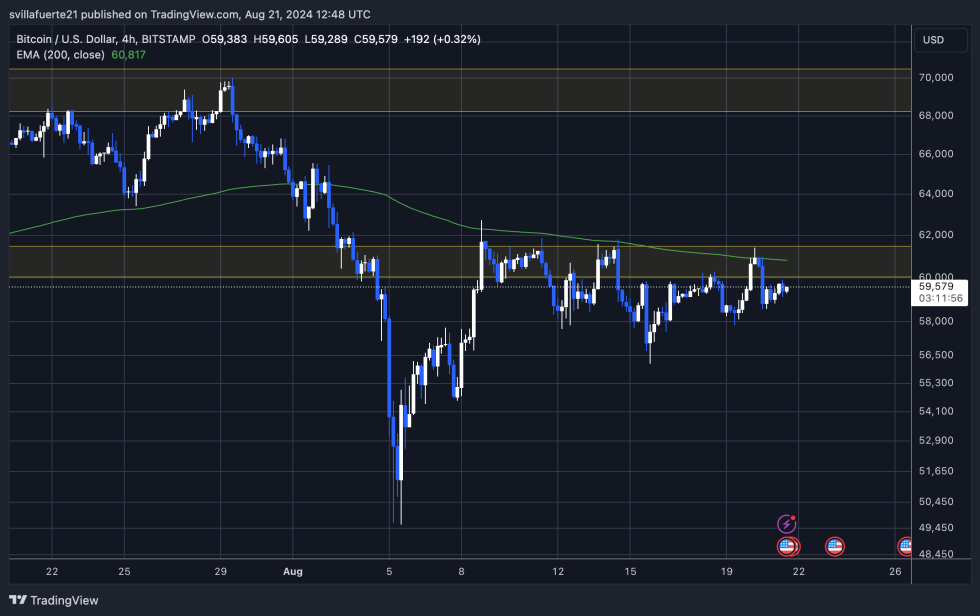
Since reaching its all-time high in March, Bitcoin has experienced four notable corrections, followed by a consolidation post-halving.
Currently trading at $59,605 below the critical $60,000 level when writing, Bitcoin must reclaim and secure this price point before any substantial upward movement can occur. The $60,000 mark serves as a psychological and technical threshold for reigniting bullish momentum.
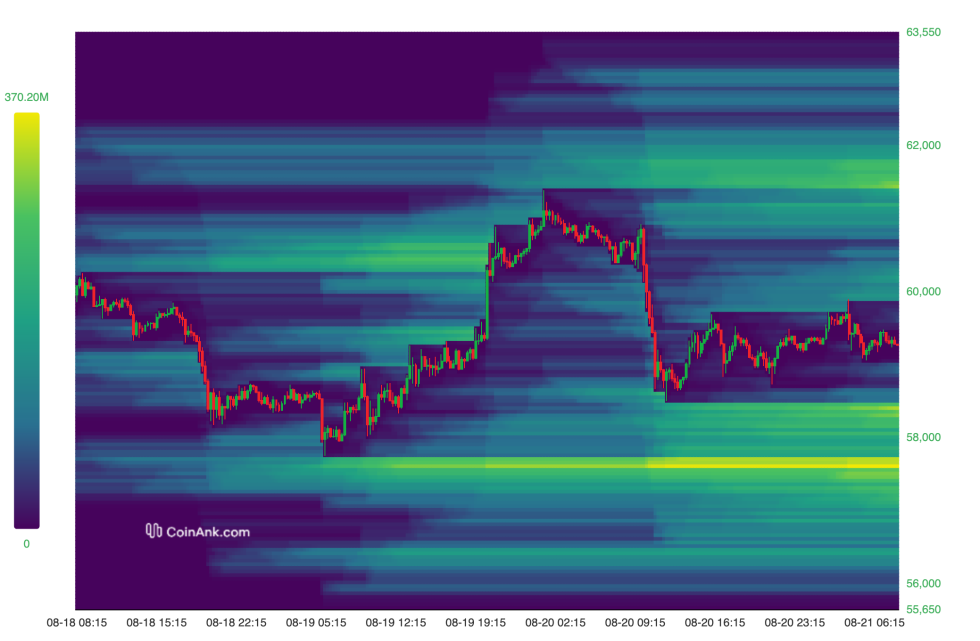
However, there remains the possibility of a further dip, with a potential retest of liquidity below $57,500. According to CoinAnk’s liquidation heatmap, significant levels of leveraged liquidity are just beneath this price, indicating that a pullback could trigger substantial liquidations and a further price decline.
Amidst this uncertainty, the recent surge in stablecoins’ market cap could be a promising sign. A rising market cap after consolidation often signals increased liquidity in the crypto ecosystem, setting the stage for a bullish recovery.
As stablecoins reach a new all-time high, it could indicate that the period of uncertainty and fear is nearing its end, providing the confidence needed for Bitcoin to resume its upward trajectory.
Cover image from Dall-E, Charts from Tradingview