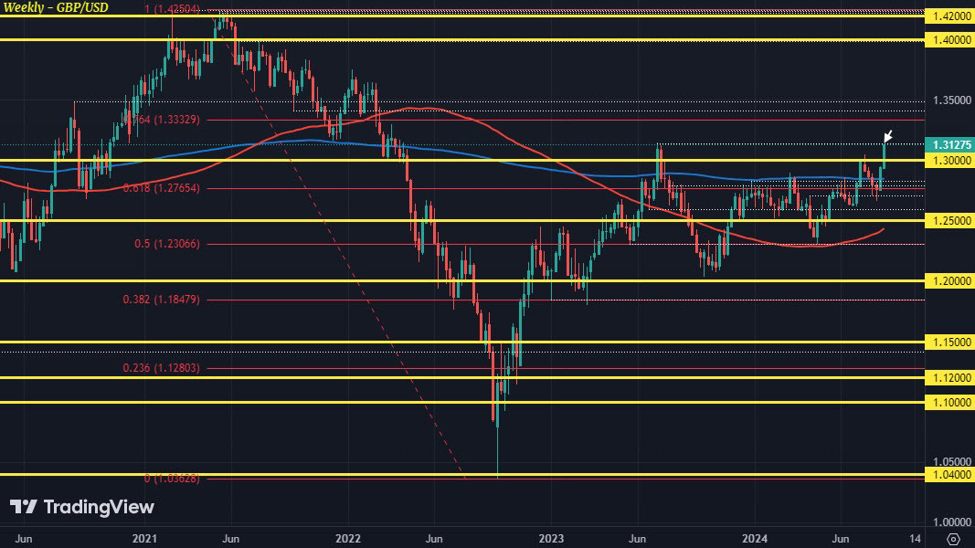
GBP/USD weekly chart
The pound has quietly been an outperformer among the major currencies in trading this year. Amid a more resilient economy and stickier inflation, the BOE has seen their rate cut plans pushed back. And that has helped to underpin the currency as most other major central banks are on track to cut rates further.
The latest to fall in that domino is the dollar, having endured a rather punishing last two weeks. In turn, GBP/USD has made significant progress in a push from 1.2800 to now above 1.3100.
And as we look to close out the week, buyers are taking aim at the 2023 high of 1.3142 currently.
Another notable development in August is that we are seeing price push above its 100-month moving average of 1.2926. GBP/USD has had a long history of struggle against its key monthly moving averages, stretching all the way back to 2008. And so, a firm break here could very well open up scope for a stronger upside push alongside the other technical levels highlighted above.
At the end of the day, it all comes down to the divergence between the BOE and Fed. And of course how quickly things will narrow once inflation pressures in the UK begins to come under control.
But with the dollar stumbling across multiple charts, it’s tough to argue against a softer backdrop for the US currency – at least for now.
All eyes will be on Fed chair Powell next to see if he will deliver another blow to the greenback before the weekend.