Jose Luis Pelaez Inc
Since the VIX (S&P volatility index) was introduced in 1990, the average has been 19.5, indicating implied daily volatility of plus or minus 1.22%.
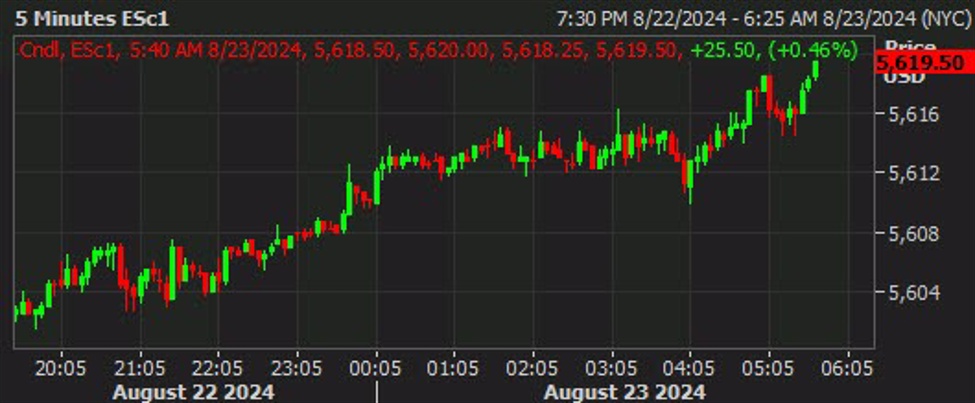
We had six weeks from May to July 16 without a single down 1%-plus day. And then this happened.
Statista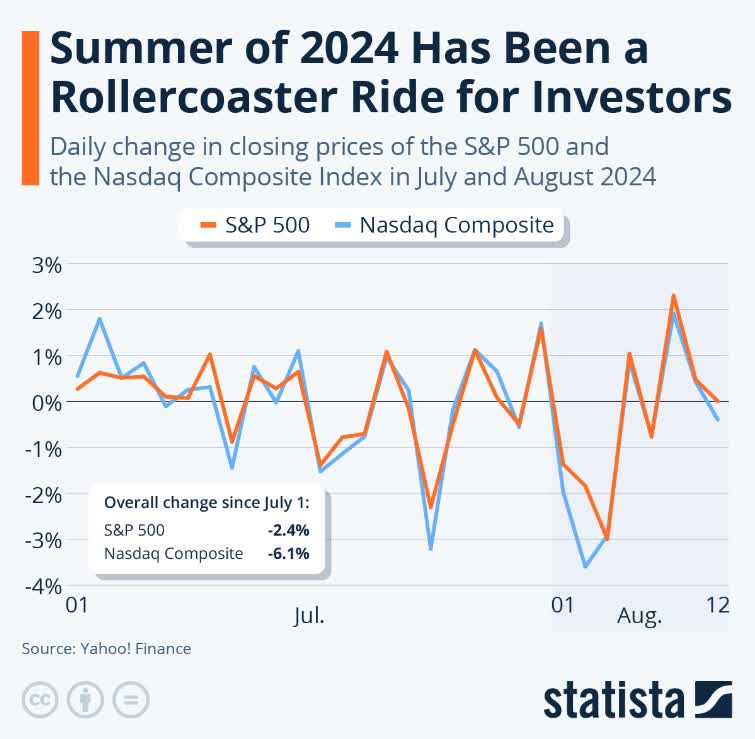
Stocks went from drifting straight up with very low volatility to steadily more frightening declines, and now stocks are melting up yet again.
YCharts YCharts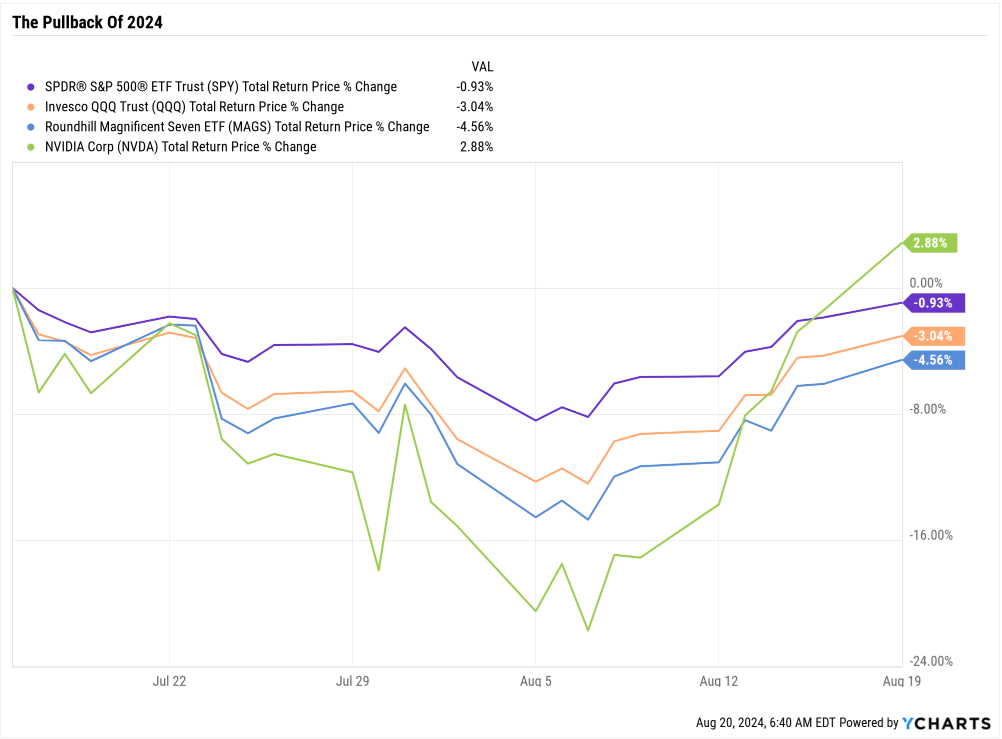
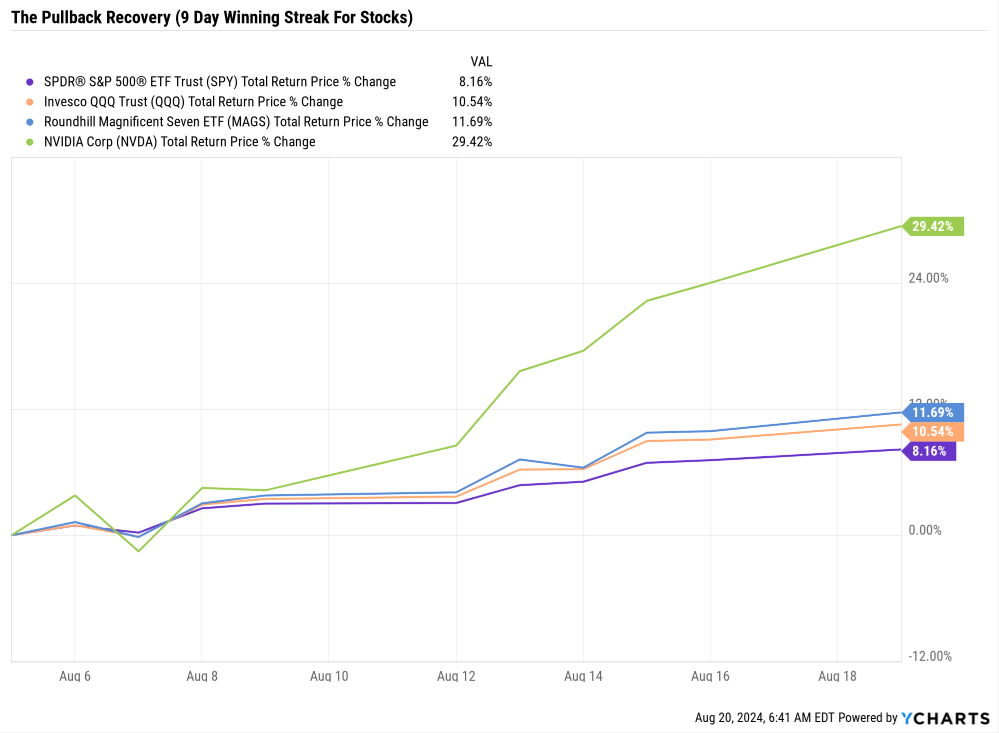
Stocks are now up eight straight days, an impressive 8%, with the Nasdaq up 11% and the Mag 7 up 12%. Much of that has been driven by NVIDIA (NVDA) and its almost 30% rally (44% off the Aug. 5 intraday low).
Naturally, such swift gains might make you think, “Is this a bubble?!” How can it not be?
Daily Shot 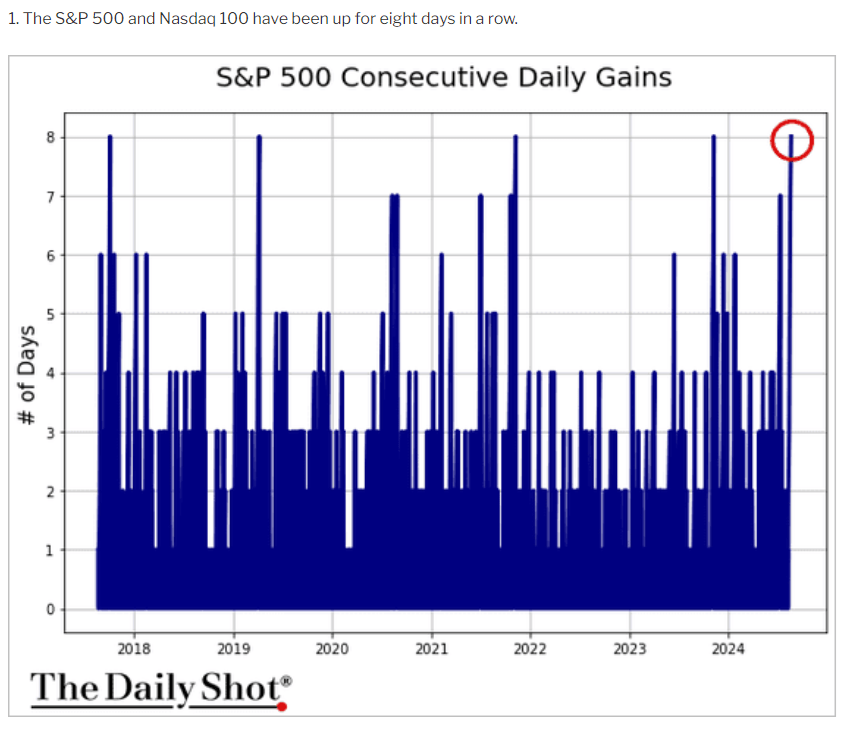
Eight-day winning streaks are common following corrections like we just saw.
Charlie Bilello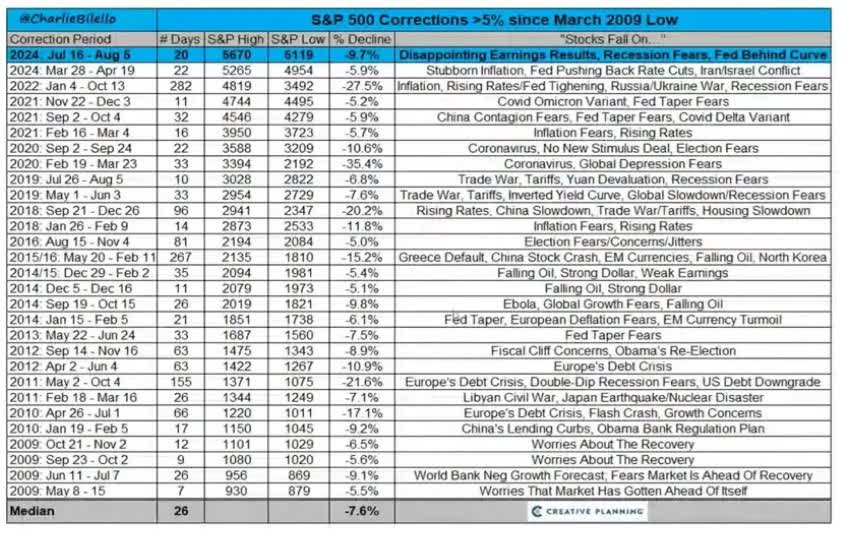
It wasn’t technically a correction—just a 9.7% decline—but one marked by the third-highest spike in volatility ever recorded.
Charlie Bilello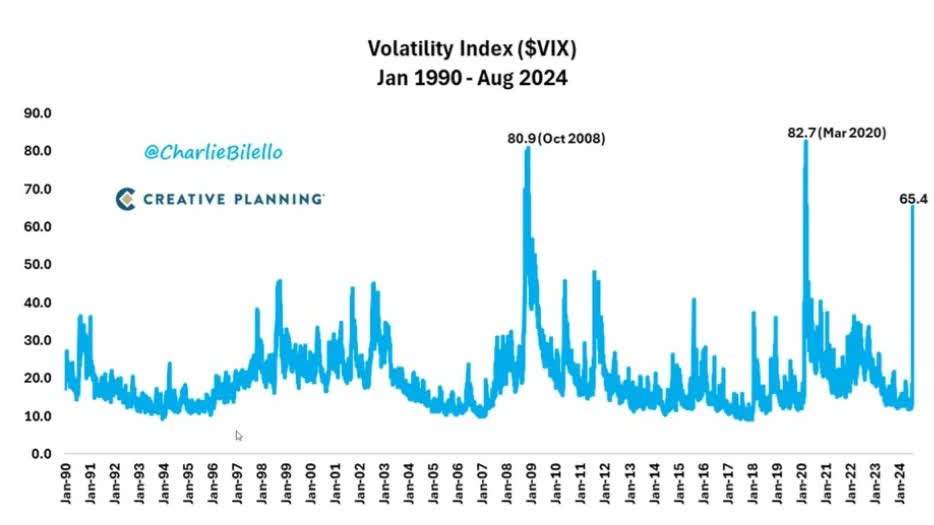
Following periods of intense volatility spikes, stocks tend to deliver exceptional returns.
Charlie Bilello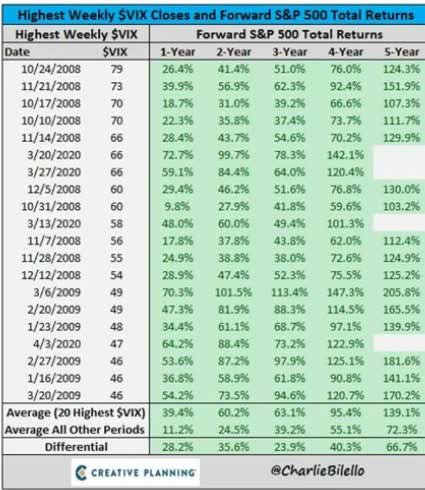
After periods of such intense volatility, the average short-term stock returns 40% within the following year. That’s nearly 4X the average 12-month return since 1926.
Following the top 20 VIX spikes in history, stocks have never failed to be positive the following year. The worst return was 9.8%, a year after the worst month for stocks in decades (October 2008).
Could This Time Be Different?
Daily Shot 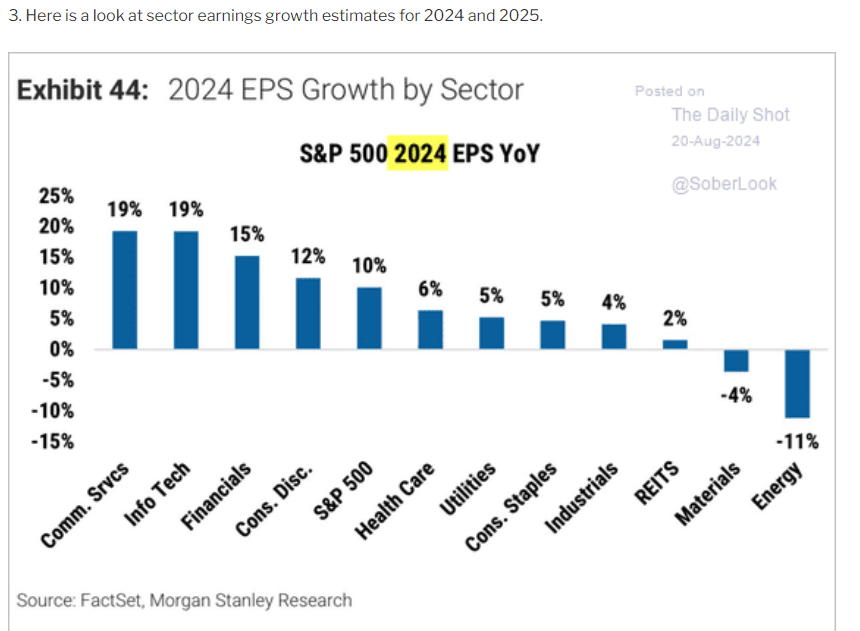
The good news is that 2024’s 10% EPS growth is expected to be powered by secular solid growers led by big tech.
Daily Shot 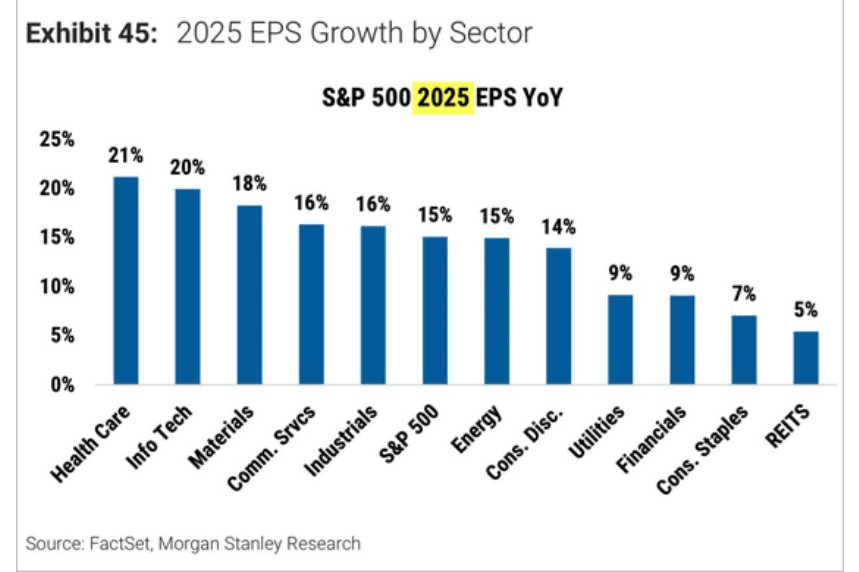
Next year is expected to be even better, with 15% EPS growth and as much as 21% in some sectors.
But those are today’s forecasts. The future is always a series of probability curves, and forecasts can change rapidly if the economy falls into recession.
Daily Shot 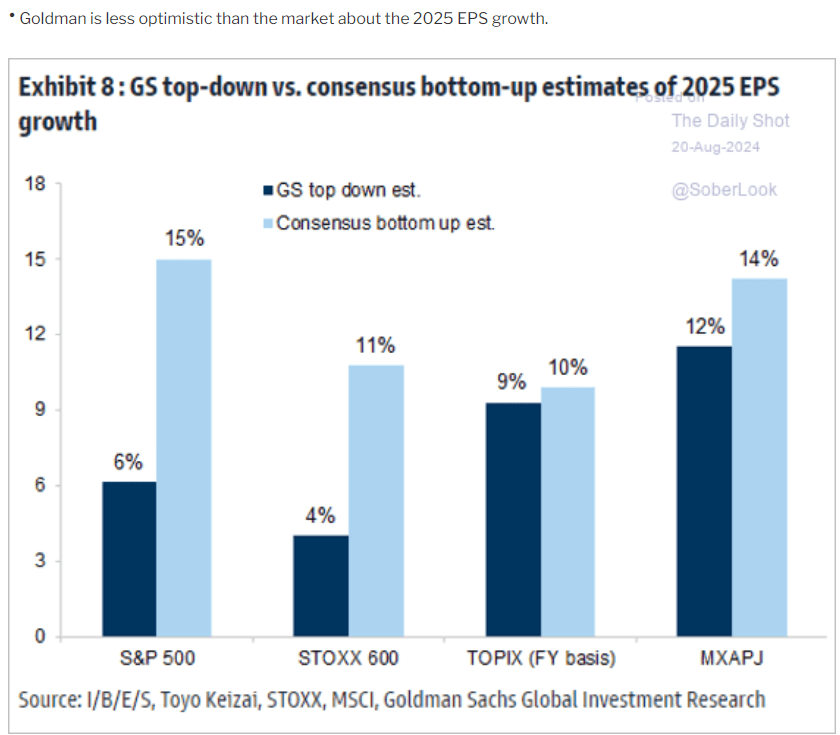
Goldman Sachs is much less optimistic about next year’s earnings, expecting just 6% growth.
Mind you, the bottom-up accuracy rate over the last 20 years, according to FactSet, is 92%. Bottom-up consensus estimates are always superior to the top-down forecasts of even the most accurate forecasters.
- Top Down = “Based on the economy, here is what our analysts think corporate profits will be.”
- Bottom-up: “Median consensus of every analyst covering an individual company, then weighted by market cap.”
But why is Goldman so much less bullish? Perhaps because of data like this.
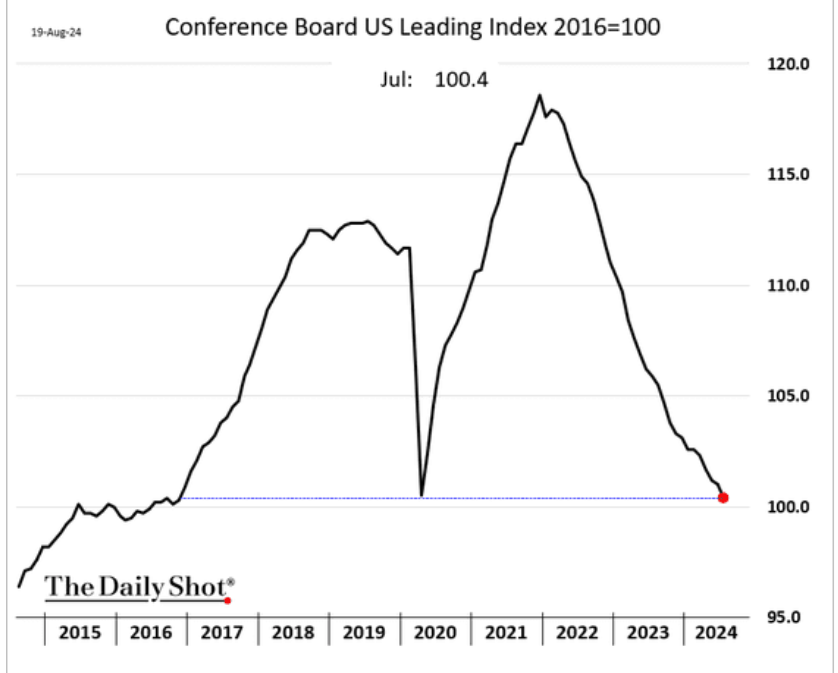
Troubling Economic Data
Daily Shot 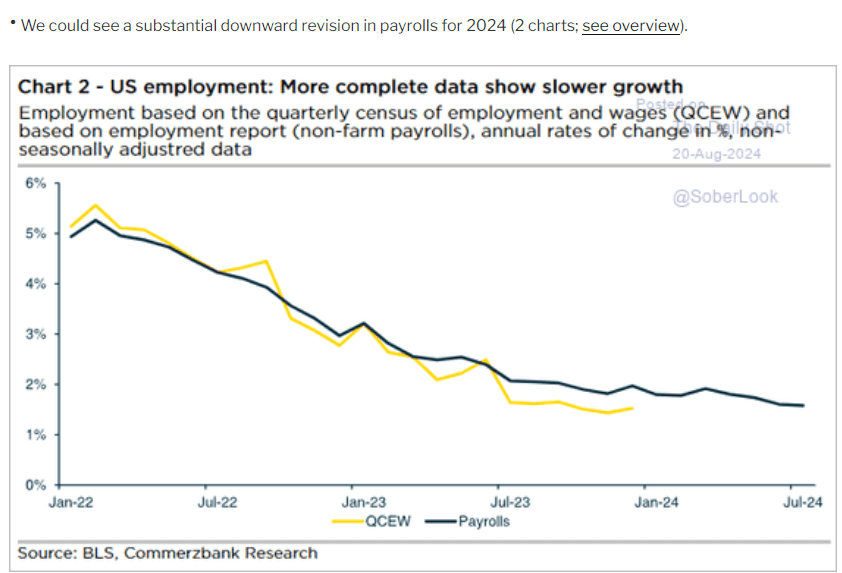
The job market might be weaker than in some popularly followed data.
Daily Shot 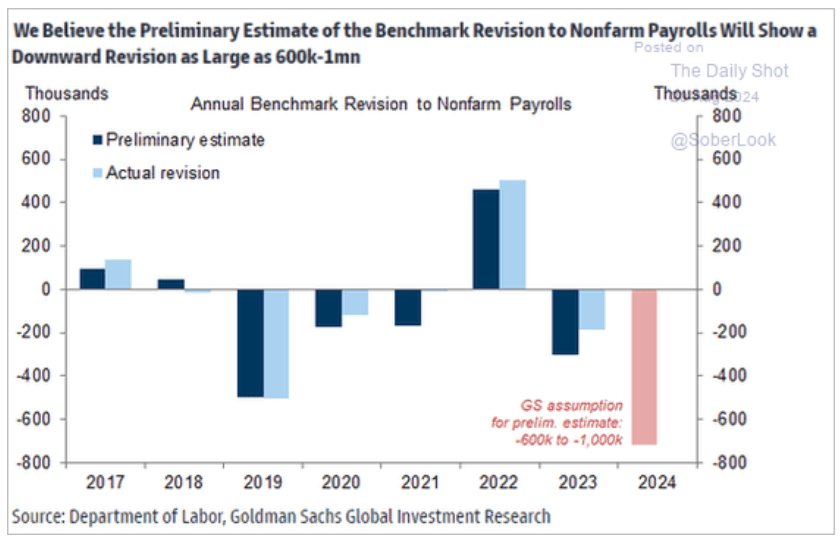
Goldman expects the upcoming annual revision to jobs reports to show 50K to 80K fewer jobs than initially reported.
If true, that could mean that job growth was close to zero in weaker months like July’s report.
Daily Shot 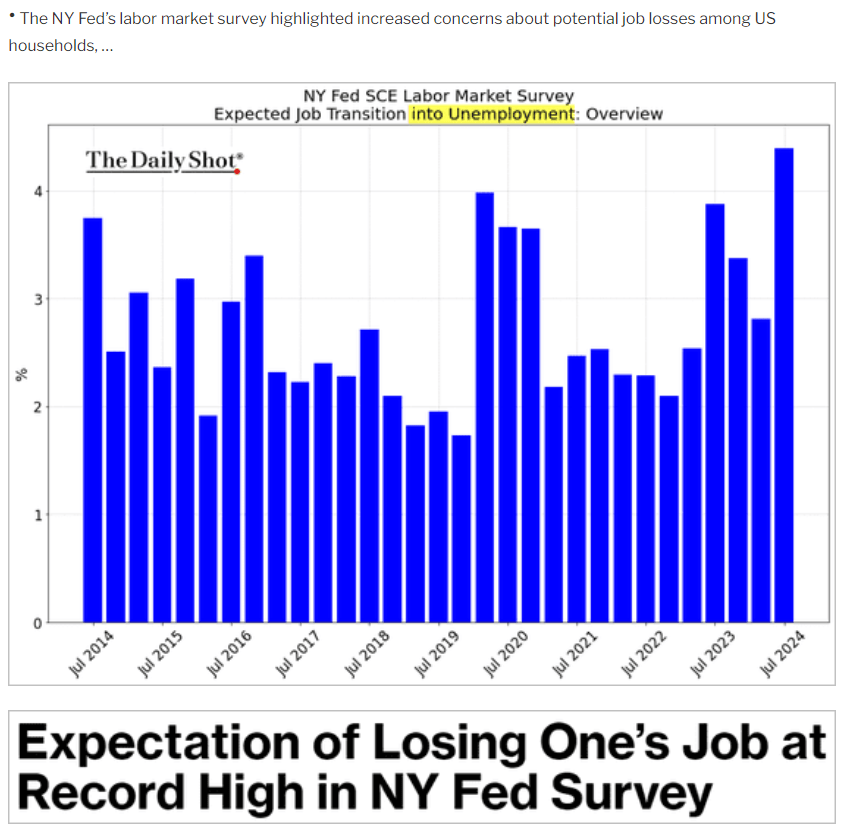
It’s essential to keep such scary headlines in context. “Record highs” mean “highest since 2014,” and in July, 4.25% of Americans were worried about losing their jobs in the next year.
Retail sales are holding up very well. The vibes might be recessionary, but the economy is stronger than the rolling two-year average and trending up, not down.
Nate Silver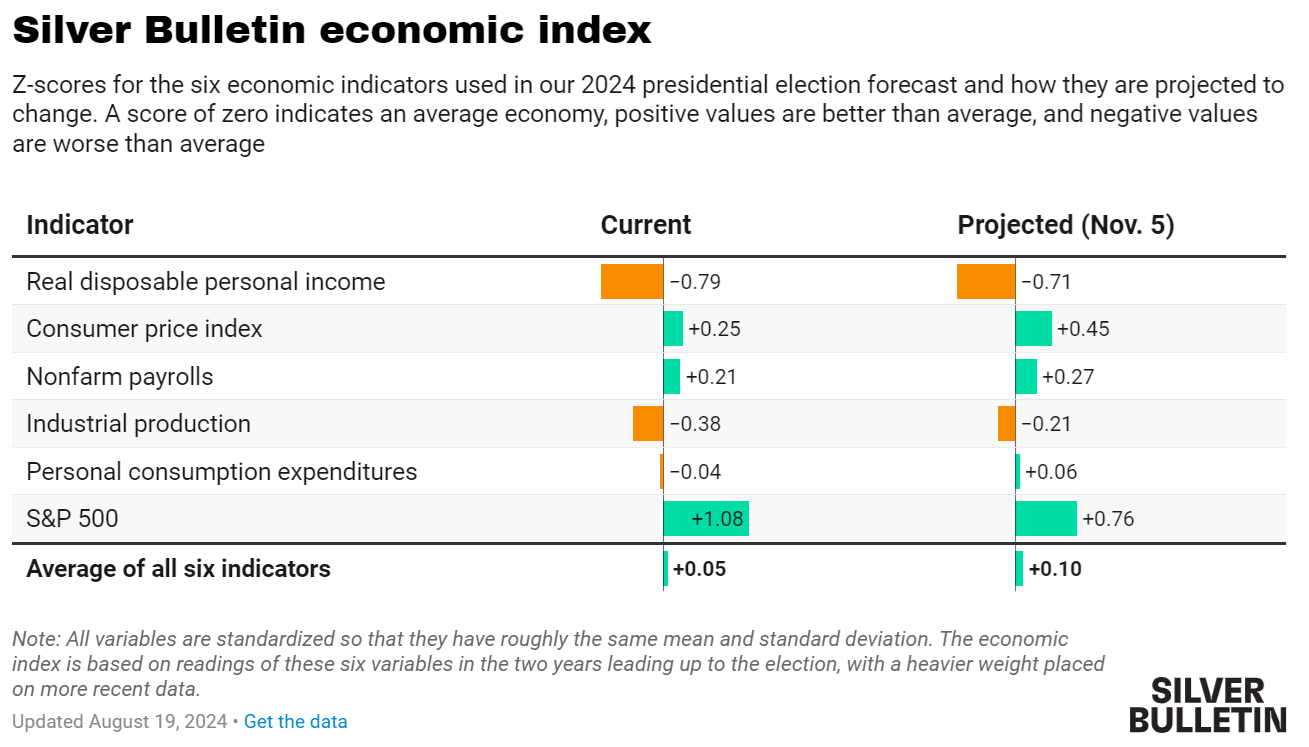
Around Aug. 5, the average of six economic indicators was -0.1, which is the standard deviation below the two-year rolling average.
Now it’s 0.05 stds above average and trending toward +0.1 stds above average by Election Day.
Daily Shot 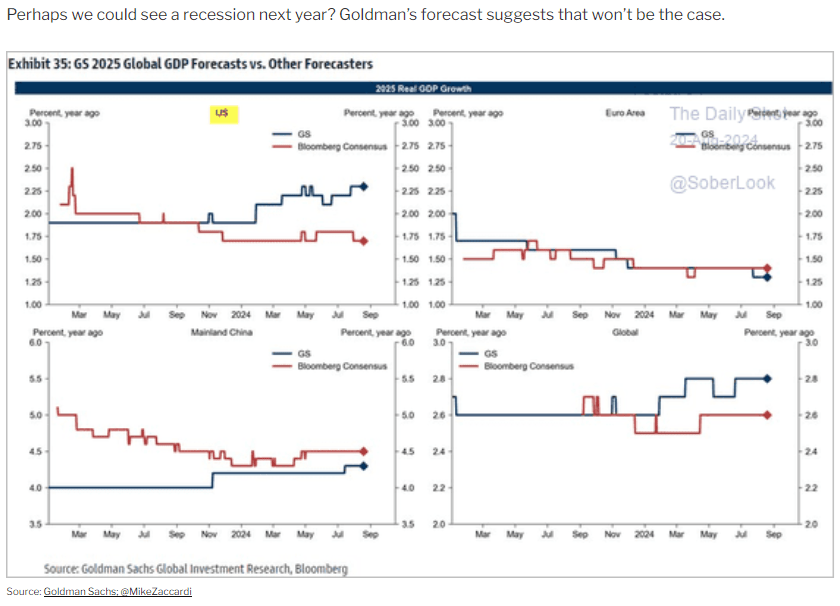
Goldman Sachs raised its recession forecast on Aug. 2 and just cut it from 25% to 20%. It says that on Sept. 6, it might cut it back to 15%, where it was on Aug. 1.
Narratives are shifting by the week, with the growth scare still the biggest brick in the wall of worry that the market is climbing.
But nowadays, it’s easy to tell any economic story you want in charts.
Daily Shot Daily Shot 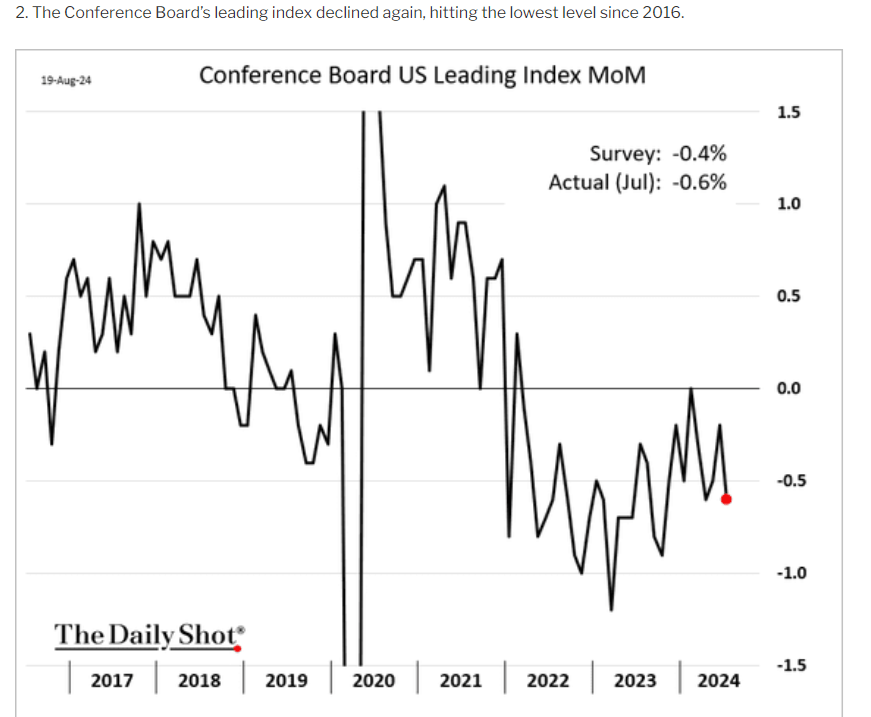
Any single indicator will never give you a complete view of the economy.
That’s why I use eight leading indicators. Each is a meta-analysis or model incorporating dozens of metrics.
Follow The Money: Financial Stress = Gold Standard of Recession Warnings
YCharts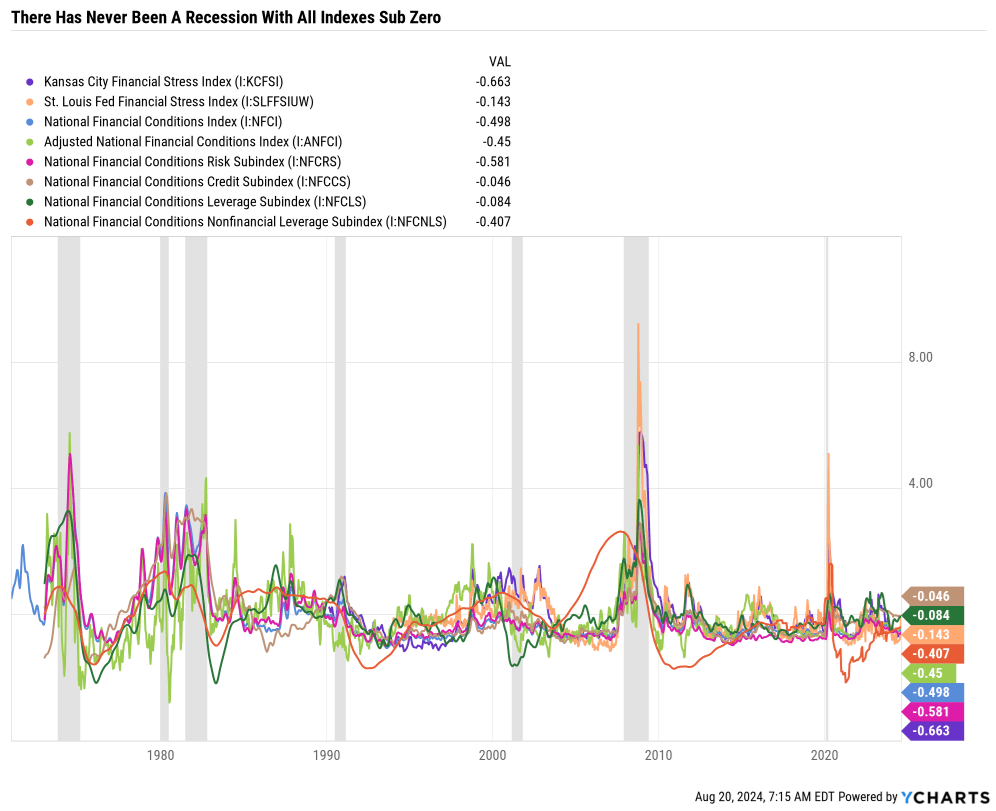
You can read the linked article to explain this chart, but the bottom line is that these numbers represent over 120 weekly financial indicators.
Since 1971, the US economy hasn’t experienced recessionary conditions as long as the trends have been negative (below average financial stress). Right now, every index and subindex say the economy is still growing.
What About Crazy Valuations?
Daily Shot 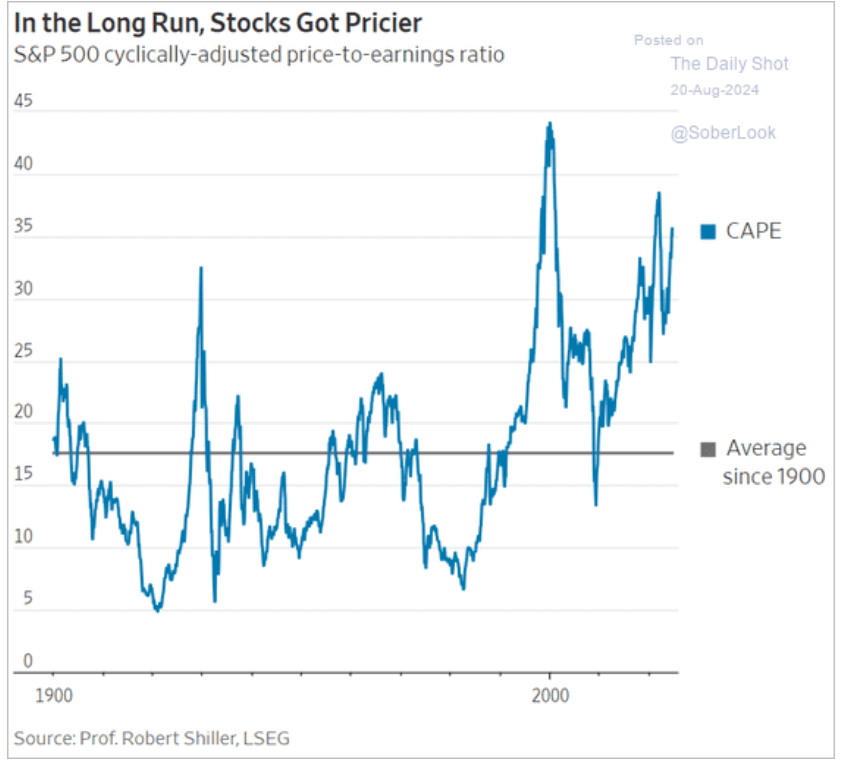
While using average valuations going back more than 100 years is not statistically valid, many investors get nervous looking at charts like this.
- In 1900, the global economy was nothing like it is today.
- No SEC, no global investors, no 401Ks.
- Average valuations have been drifting higher for over 50 years.
But the good news for value investors, or anyone who feels uncomfortable buying stocks at such high absolute valuations, is that it’s always and forever a market of stocks, not a stock market.
8% Yielding Blue-Chips: The Solution To “Crazy” Valuations
If you can’t shake the feeling that the market is wrong, even though it’s “been wrong” for 15 years now, consider ultra-yield blue chips.
You can find 7% or even 8% yielding blue chips with investment-grade balance sheets, very low-risk dividends, and S&P risk management that’s in the top 33% of global companies.
When you earn 7% or 8% yield, you only need 2% to 3% long-term growth, basically keeping up with inflation, to earn the market’s historical 10% returns (7% inflation-adjusted since 1800).
Ritholtz Wealth Management 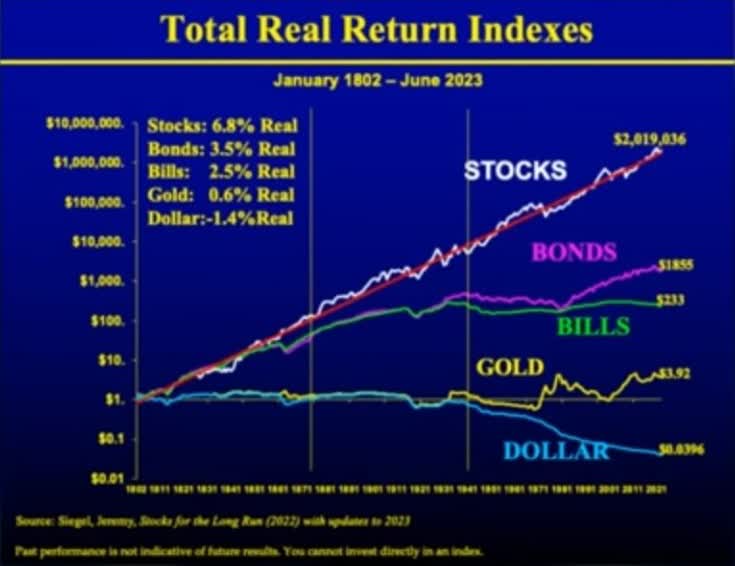
Stocks delivered 7% real return for 220 years and the last 100, 50, and 25.
While past performance does not guarantee future returns, centuries of US stocks doubling inflation-adjusted wealth every decade indicate that 7% real return expectations going forward are reasonable.
S&P Cash-Adjusted Valuation
| Week | 34 | |
| % Of Year Done | 2024 Weighting | 2025 Weighting |
| 65.38% | 34.62% | 65.38% |
| Forward S&P EV/EBITDA (Cash-Adjusted Earnings) | 10-Year Rolling Average | Market Overvaluation |
| 14.38 | 13.65 | 5.33% |
| S&P Fair Value | Decline To Fair Value | Fair Value PE |
| 5,324.26 | 5.06% | 19.92 |
(Source: Dividend Kings S&P Valuation Tool)
Growth and Cash-Adjusted Valuation
| Potential Overvaluation (10-Year Average) | S&P 10-Year Average Cash-Adjusted PEG | S&P Current Cash-Adjusted PEG |
| -32.31% | 1.77 | 1.20 |
| Potential Overvaluation (25-Year Average) | S&P 20-Year Average |
S&P Current Cash-Adjusted PEG |
| -50.49% | 2.42 | 1.20 |
| PEG Adjusted Overvaluation | Immediate Justified Upside Potential (1.44 PEG) | Potential 12-Month Fundamentals Justified Returns |
| -12.85% | 11.47% | 27.77% |
(Source: Dividend Kings S&P Valuation Tool)
OK, this is all very bullish but speculative, right?
If and only if S&P profits grow 2X as fast as they have in the past (and since 2020) into the future, could these total return potentials actually be justified?
On the other hand, if you’re getting a 7% to 8% blue-chip yield, you don’t have to worry about 12% profit growth. All you need is companies to grow earnings and dividends at the same rate as inflation, and you can earn double-digit returns… while potentially using dividends to fund a comfortable or even rich retirement.
How To Find The Best 8% Yielding Blue Chips
Finding low-risk 8% yield from quality companies is challenging because I refuse to recommend junk yield that will likely face a dividend hike.
Hartford Funds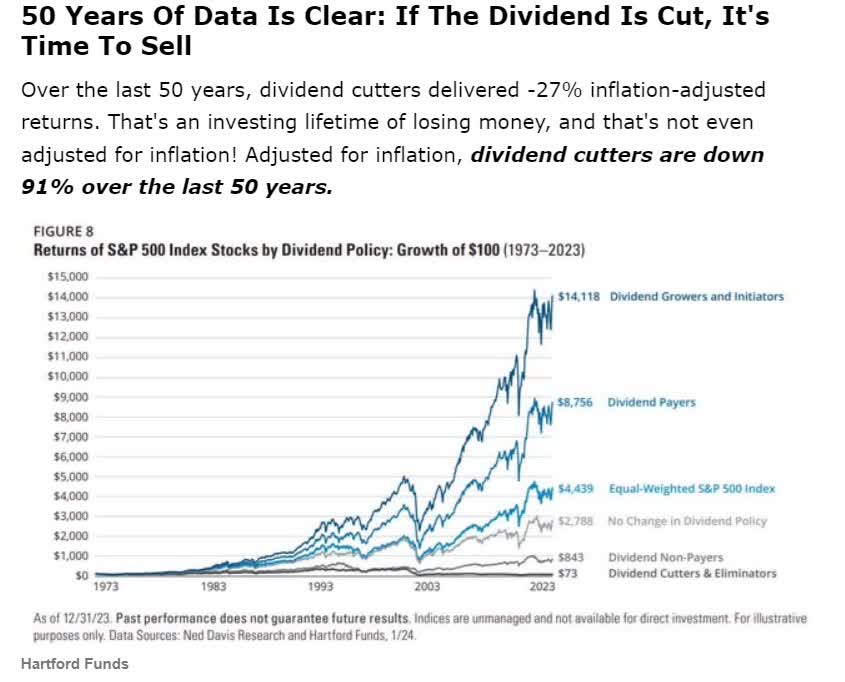
So, for today’s screen, I used the following criteria.
- Blue chip quality or better.
- Fair value or better.
- Investment-grade credit rating.
- 7.5+% yield (rounds up to 8%).
Three of these companies are Super SWANs or Ultra SWANs, the highest quality companies.
Two are more speculative, though not unsafe, and are A-rated by S&P, though their businesses are more cyclical.
Five 8% Yielding Blue-Chip Bargains
Dividend Kings Zen Research Terminal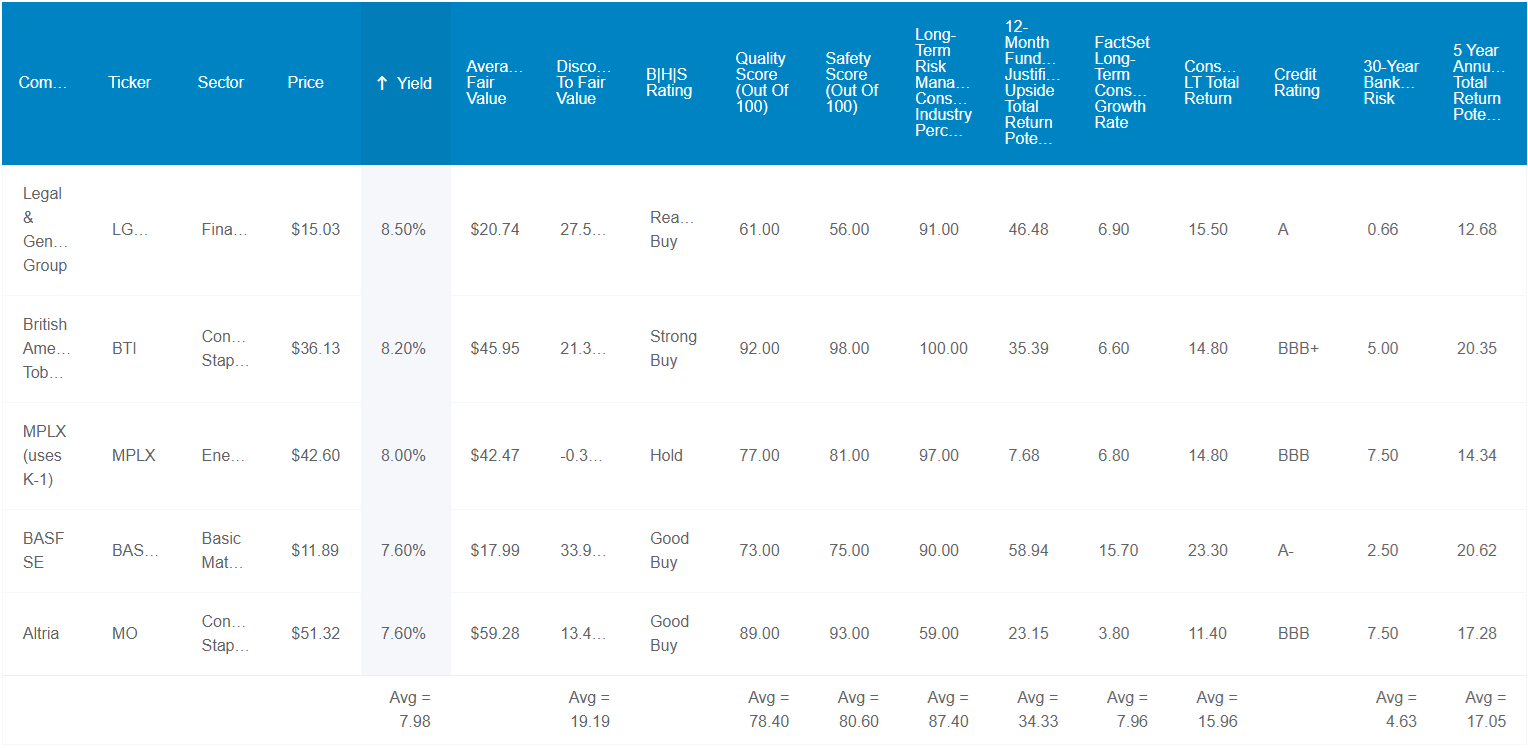
Fundamental Summary
8% yield vs 1.3% S&P, 3% Vanguard High-Yield, 4% SCHD, and 3% long-term risk-free cash yield (bond market consensus).
19% discount to historical fair value vs 5% S&P premium.
For context, 19% is approximately the same discount as ETFs like SCHD, but with a low-risk yield that’s 2X as high.
Their average quality is blue chip with 80.6% dividend safety, which indicates a 1% risk of a dividend cut right now, less than 2% risk of a cut in a historically average recession, and a 4% risk of a cut even in another Great Recession level downturn.
S&P rates these companies BBB+ stable, ranging from BBB to A stable. Their average 30-year bankruptcy risk is 4.63%, the approximate risk of losing 100% of your money if you buy them today.
S&P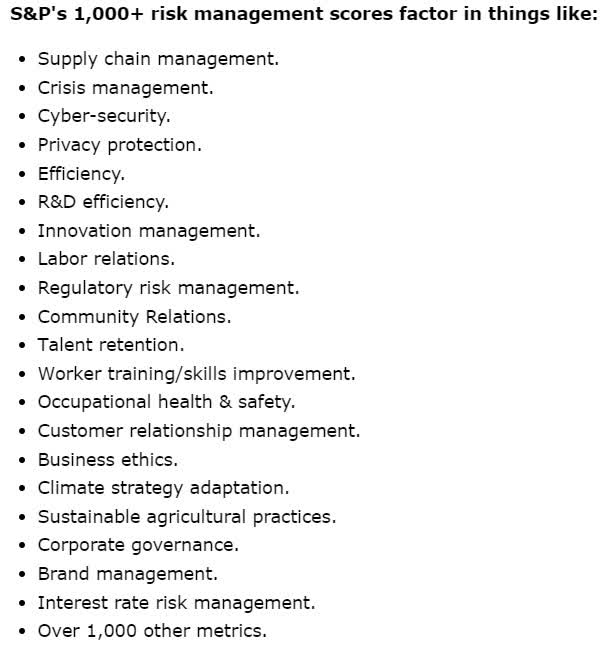
S&P rates not just credit ratings but also an overall long-term risk in more than 1,000 categories, including interest rate, regulatory, and cybersecurity risk.
These five 8% yielding blue-chips are BBB+ stable rated, with long-term risk management in the top 12% of global companies—that’s the top 1/8th of long-term risk management.
All that quality and low-risk income and at a 20% historical discount.
While most high-yield companies have slow growth, such as SCHD’s 6% growth rate, these five blue chips have consensus forecasts of 8% growth.
- 8% yield today.
- 8% EPS and dividend growth consensus.
- 16% long-term total return consensus.
- 16% long-term income growth consensus (if you reinvest dividends).
For context:
- S&P’s historical returns: 10%.
- Nasdaq’s historical return (40 years): 13.5%.
- S&P consensus future returns: 13.2%
- Nasdaq consensus future returns: 16%
Analysts are very bullish on long-term growth prospects for large-cap growth.
But what if you could achieve the same total return potential while getting a 10X higher yield?
And it’s not just the long-term return potential that’s excellent.
The five-year consensus return potential is 17% per year.
- 120% five-year consensus return potential vs 85% S&P.
And over the next year alone, their fundamentally justified return potential is 34%.
That’s not a forecast. It means that “if and only if these companies grow as expected and each returns to historical fair value, a 34% total return a year from now would be 100% justified.”
But remember, the S&P, under the most optimistic outlooks and scenarios, can’t justify more than a 27% total return in the next year.
The S&P is down to a 1.2% yield, while you can lock in an 8% yield today with these five blue chips.
- 8% yield today.
- 8% dividend growth consensus
- 5.7% inflation-adjusted income growth (doubling every 12.6 years)
- 13.7% inflation-adjusted income growth (dividend reinvestment), doubling every 5.5 years.
- 29% consensus inflation-adjusted yield on cost in 10 years (dividend reinvestment).
- 14% consensus inflation-adjusted yield on cost in 10 years (spending all the dividends).
Whether looking for yield, value, or total returns, these five 8% yielding blue chips offer awe-inspiring potential and attractive attributes.
But what evidence is there that they can achieve these incredible returns and income growth?
Historical Returns Since 2001
Portfolio Visualizer 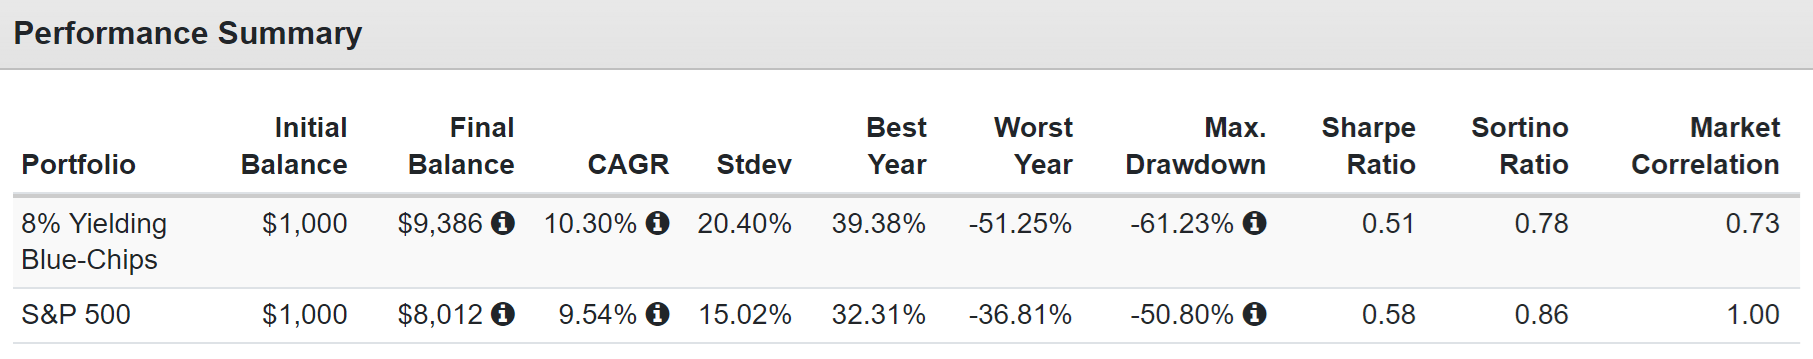
For the last 23 years, these ultra-yield blue chips beat the S&P though with higher volatility (as you’d expect from just five stocks).
Portfolio Visualizer 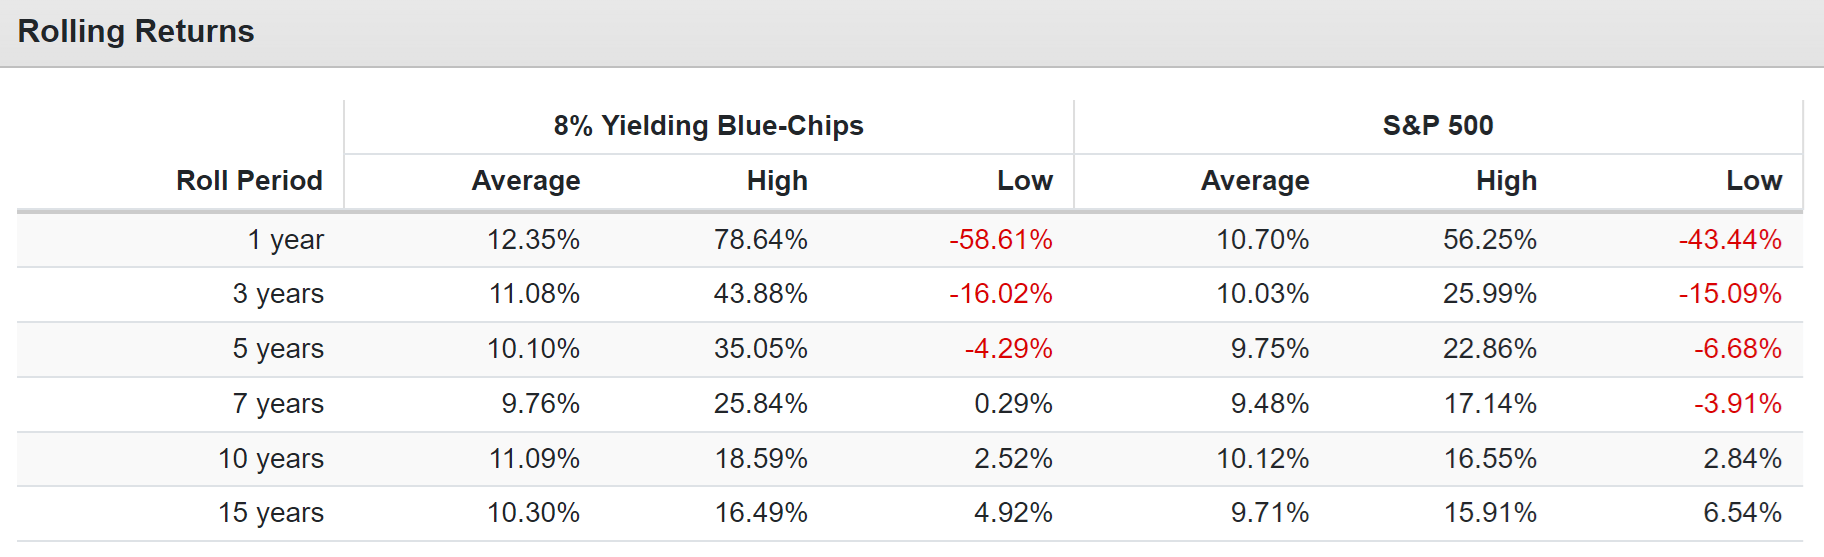
These blue chips delivered an average annual return of 12.4%, less than analysts expect today (I’ll explain why in the risk section).
Portfolio Visualizer 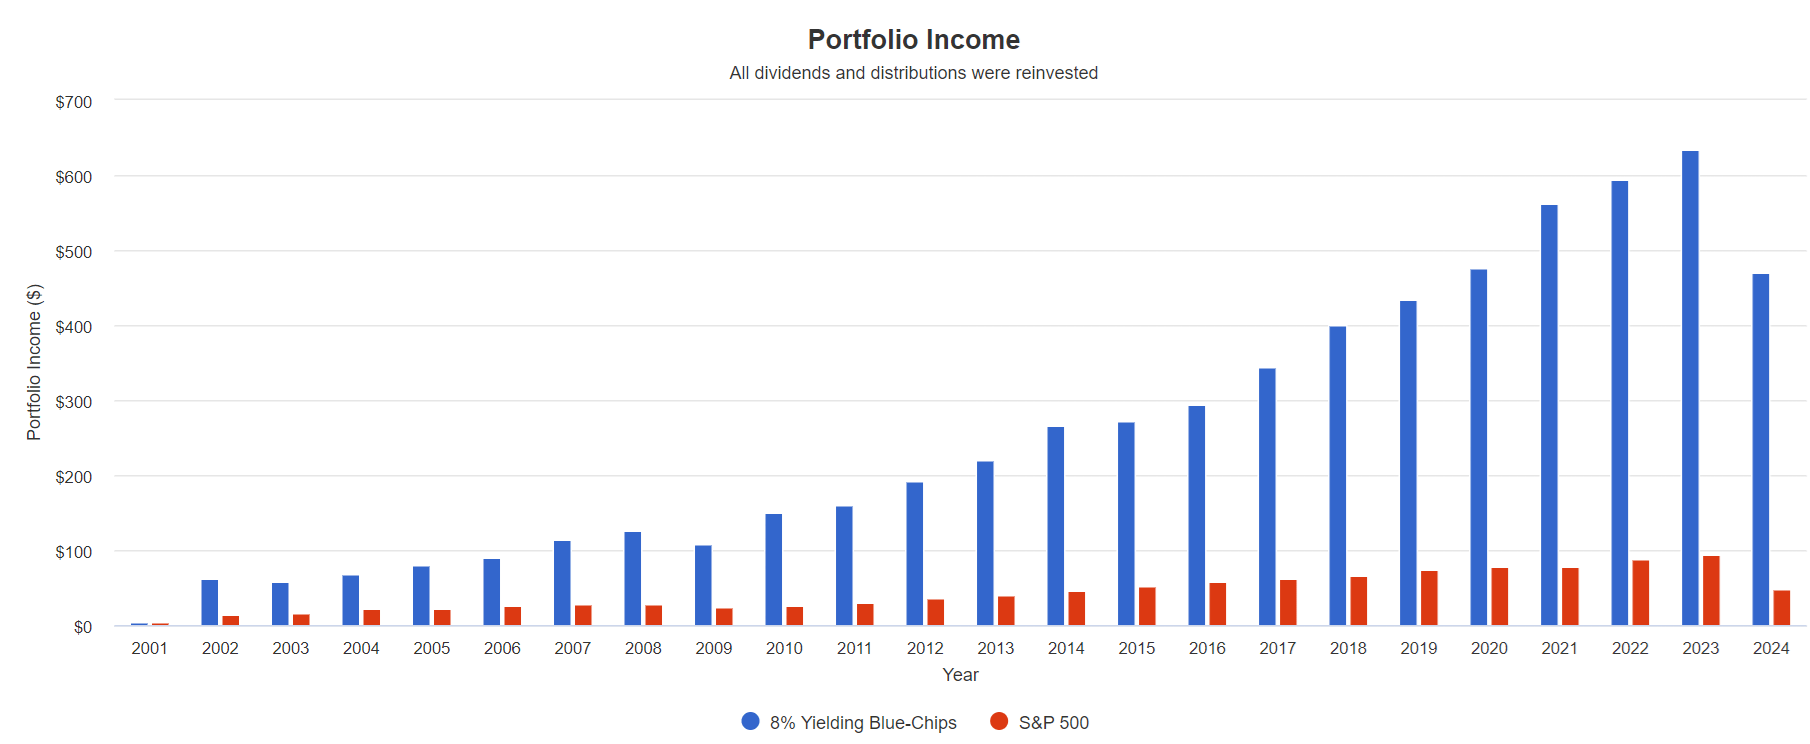
$1,000 Initial Investment In 2001
| Metric | 8% Yielding Blue-Chips | S&P |
| Total Income | $6,173.65 | $1,058.24 |
| Starting Yield | 6.11% | 1.43% |
| Yield On Cost | 94.1% | 9.7% |
| Income Growth | 11.8% | 9.4% |
(Source: Portfolio Visualizer)
These 8% yielding blue chips have delivered about 12% income growth for nearly a quarter century and are far more reliable than the S&P.
In 2001, they yielded 2% less than today and delivered 12% returns with 5% average annual dividend growth.
Of course, the nice thing about buying 20% undervalued blue chips is that you don’t have to wait decades for potentially life-changing income and total returns.
Consensus 2026 Total Return Potential
- Not a forecast.
- Consensus return potential.
- These are the expected returns if and only if these companies grow as expected and return to historical fair value by the end of 2026.
- Fundamentals would justify that.
Average: 87% = 23.3% annually vs 35% or 12% annually S&P.
1-Year Fundamentally Justified Upside Potential: 34% vs 8% to 27% S&P.
BASF SE (OTCQX:BASFY)2026 Consensus Return Potential
FAST Graphs, FactSet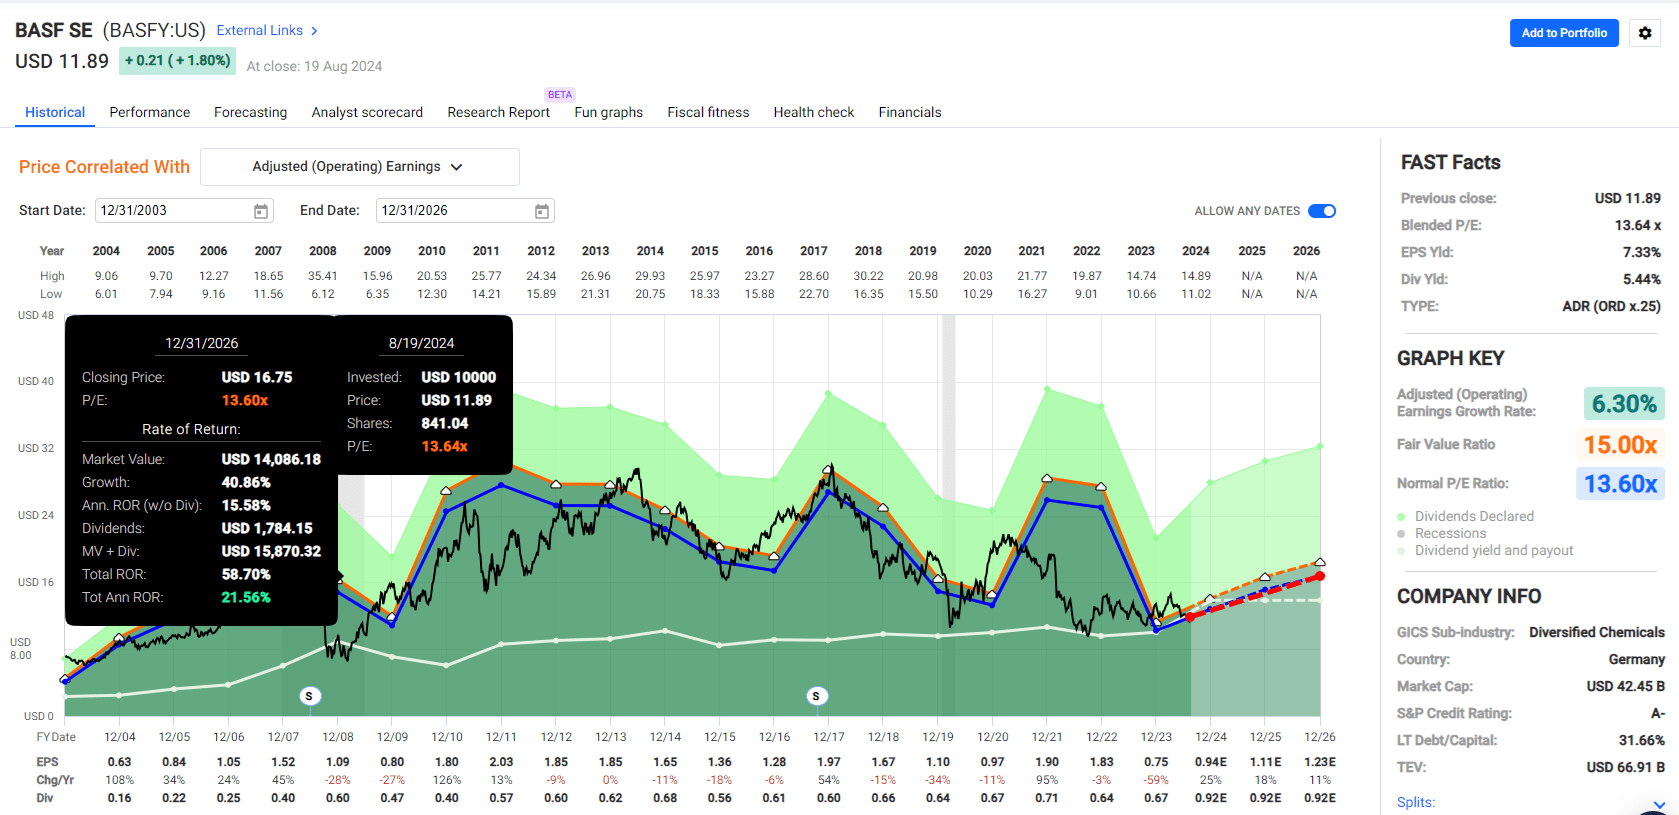
Legal & General (OTCPK:LGGNY) 2026 Consensus Return Potential
FAST Graphs, FactSet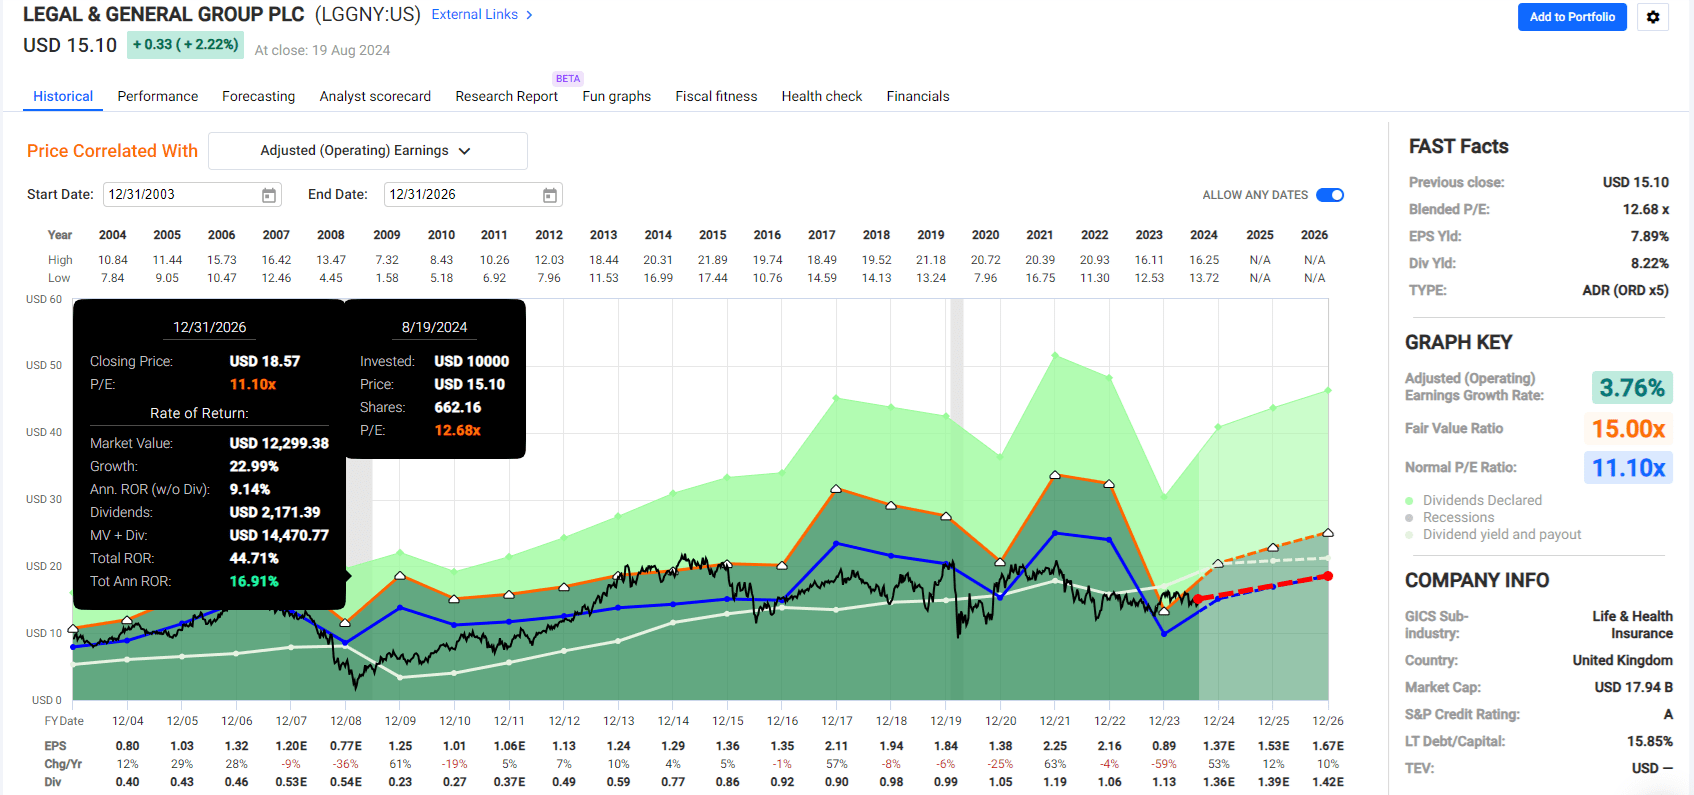
British American Tobacco (BTI) 2026 Consensus Return Potential
FAST Graphs, FactSet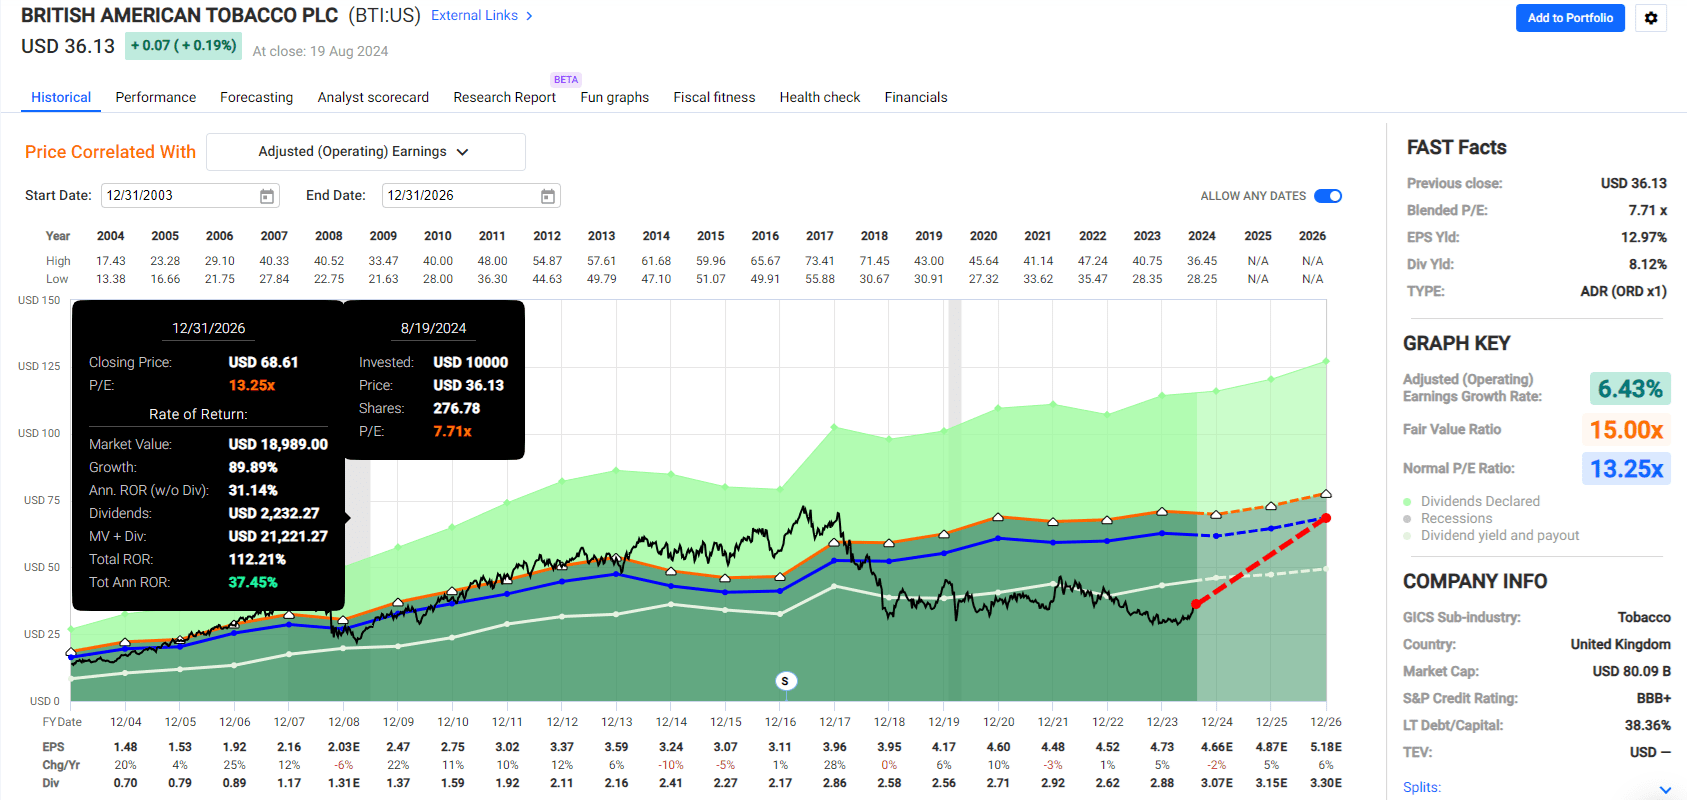
Altria (MO) 2026 Consensus Return Potential
FAST Graphs, FactSet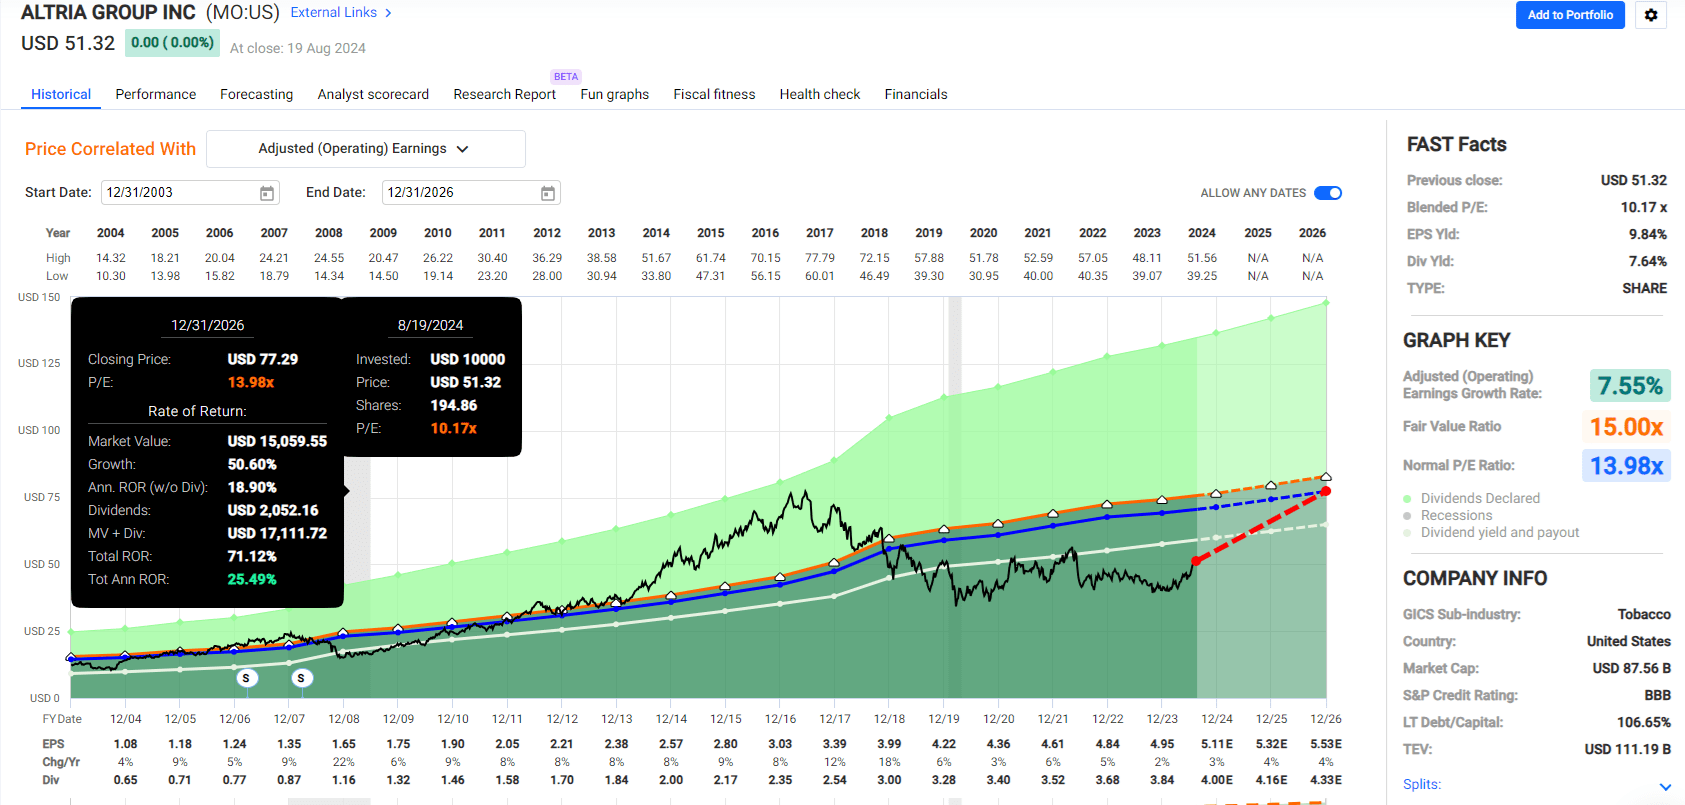
MPLX (MPLX) 2026 Consensus Return Potential
FAST Graphs, FactSet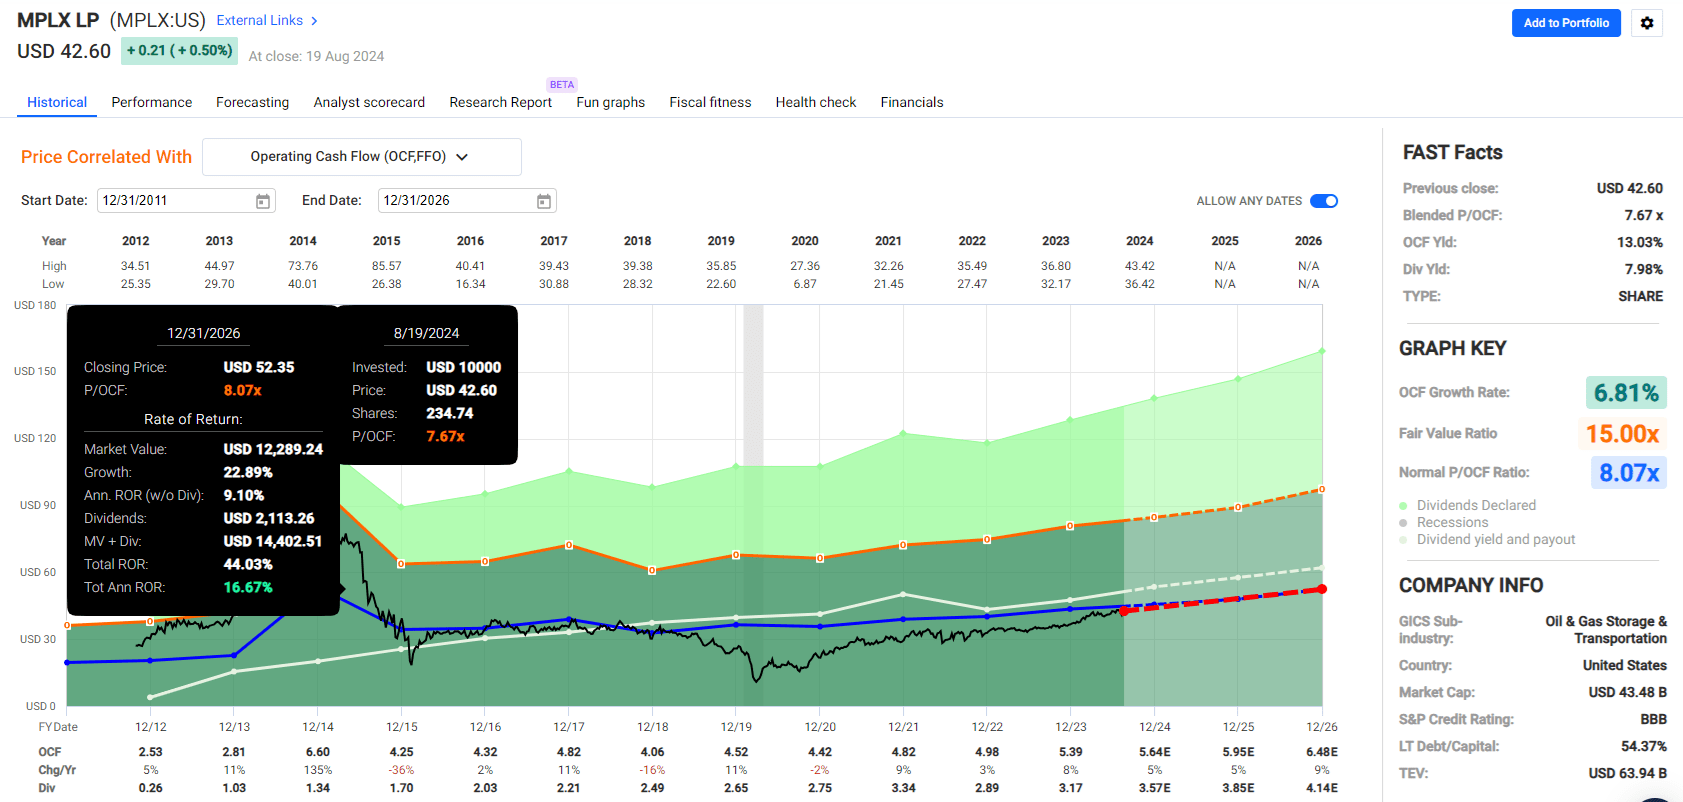
Risks To Consider: Why These Companies Aren’t Right For Everyone
MPLX is a Master Limited Partnership, which means it has complex tax implications for investors in the US and overseas.
- Enterprise Products Partners: An A-Rated 7.3% Yielding Dividend Aristocrat With Room To Run
- See the risk section for detailed tax implications of MLPs.
MPLX uses a K1 tax form, which means that it’s best owned in taxable accounts to take advantage of the tax-deferred nature of its distribution.
Legal And General and BASF are UK and German companies, respectively.
German companies have 26.375% dividend tax withholdings. You can get a tax credit only if you own German companies in taxable accounts.
The withholding still occurs in tax-deferred accounts, but you can’t get tax credits for 401Ks, IRAs, etc.
In contrast, UK companies (other than REITs) have no dividend withholding, so it doesn’t matter whether you own it in taxable or tax-deferred accounts.
However, BASF is a more cyclical company, with an earnings bear market since 2011.
FAST Graphs, FactSet FactSet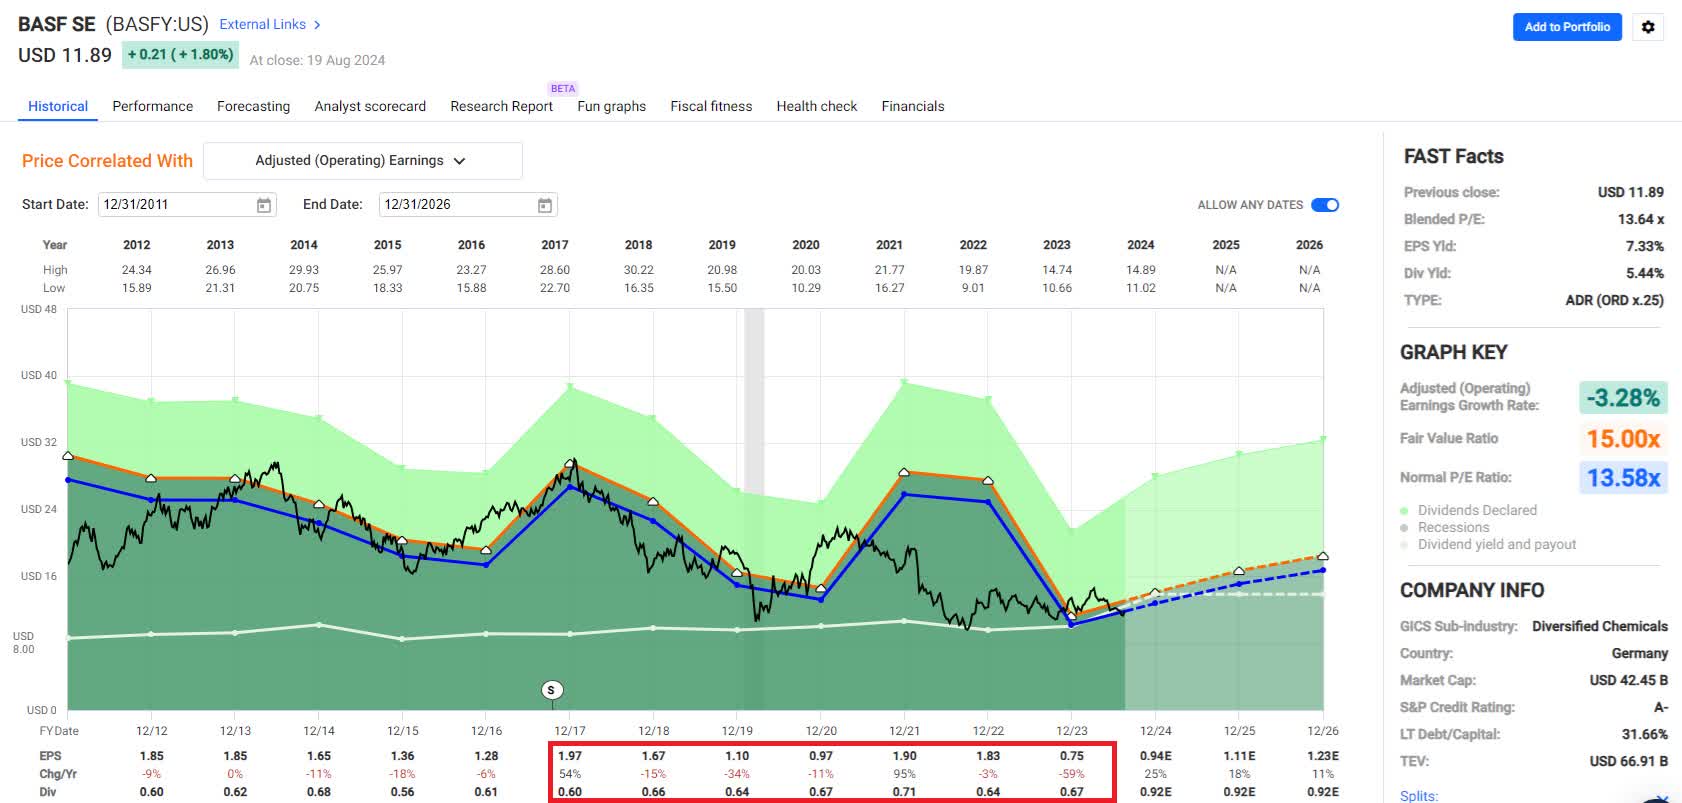

BASF has been a dependable dividend payer, avoiding dividend cuts since at least 2010 in local currency.
However, that might have been due to its low starting payout ratio, which gave it a lot of safety buffer.
A-rated BASF can borrow to sustain the dividend in the short term, but if there’s a global recession, it might cut its dividend as some analysts expect (though it’s a minority of analysts).
FactSet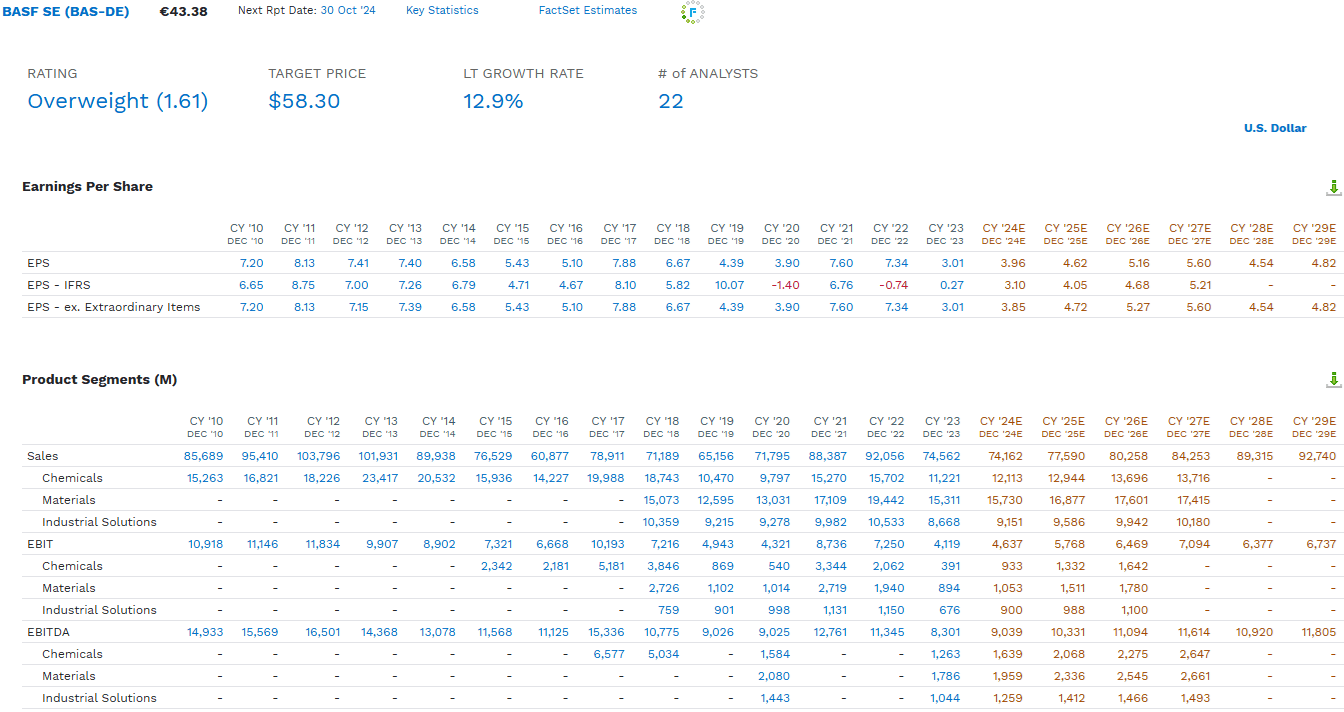
BASF is a speculative blue chip as it is expected to return to strong growth in the future, but it has to prove that it can deliver that growth.
In other words, while the 8% yield appears relatively low risk today, that might not hold if the global economy is weaker than expected in 2025 or 2026.
FAST Graphs, FactSet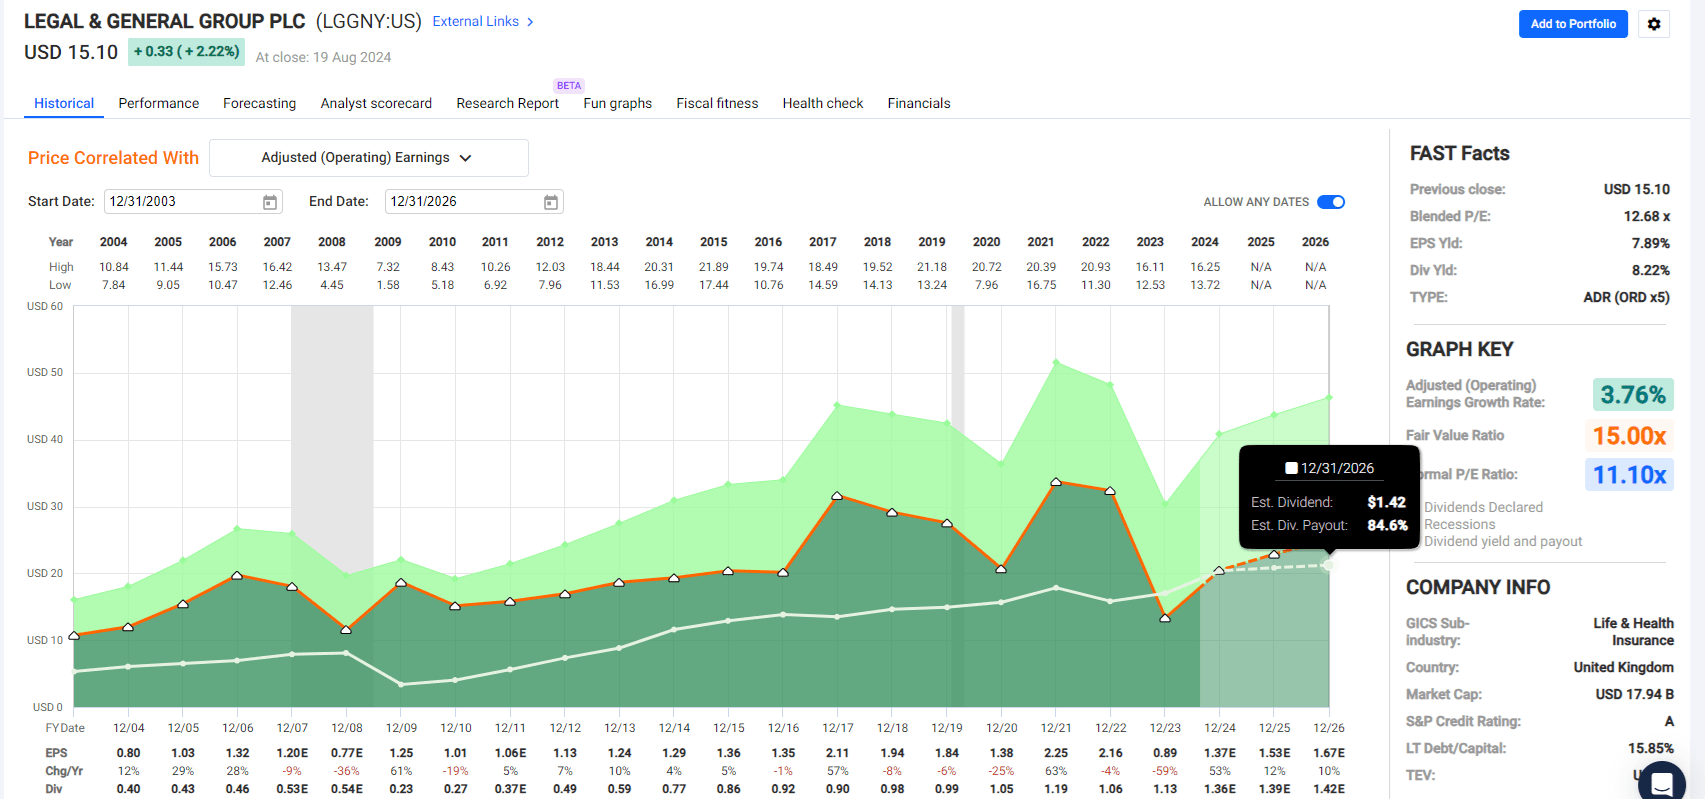
LGGNY has historically used a 35% to 50% payout ratio range to maintain dividend safety buffers.
In 2020, Legal & General reiterated its progressive dividend policy, which reflects the group’s medium-term underlying business growth, including net cash generation and operating earnings.
In other words, LGGNY plans to raise or keep the dividend flat and never cut it unless necessary, even if EPS falls in any given year.
FactSet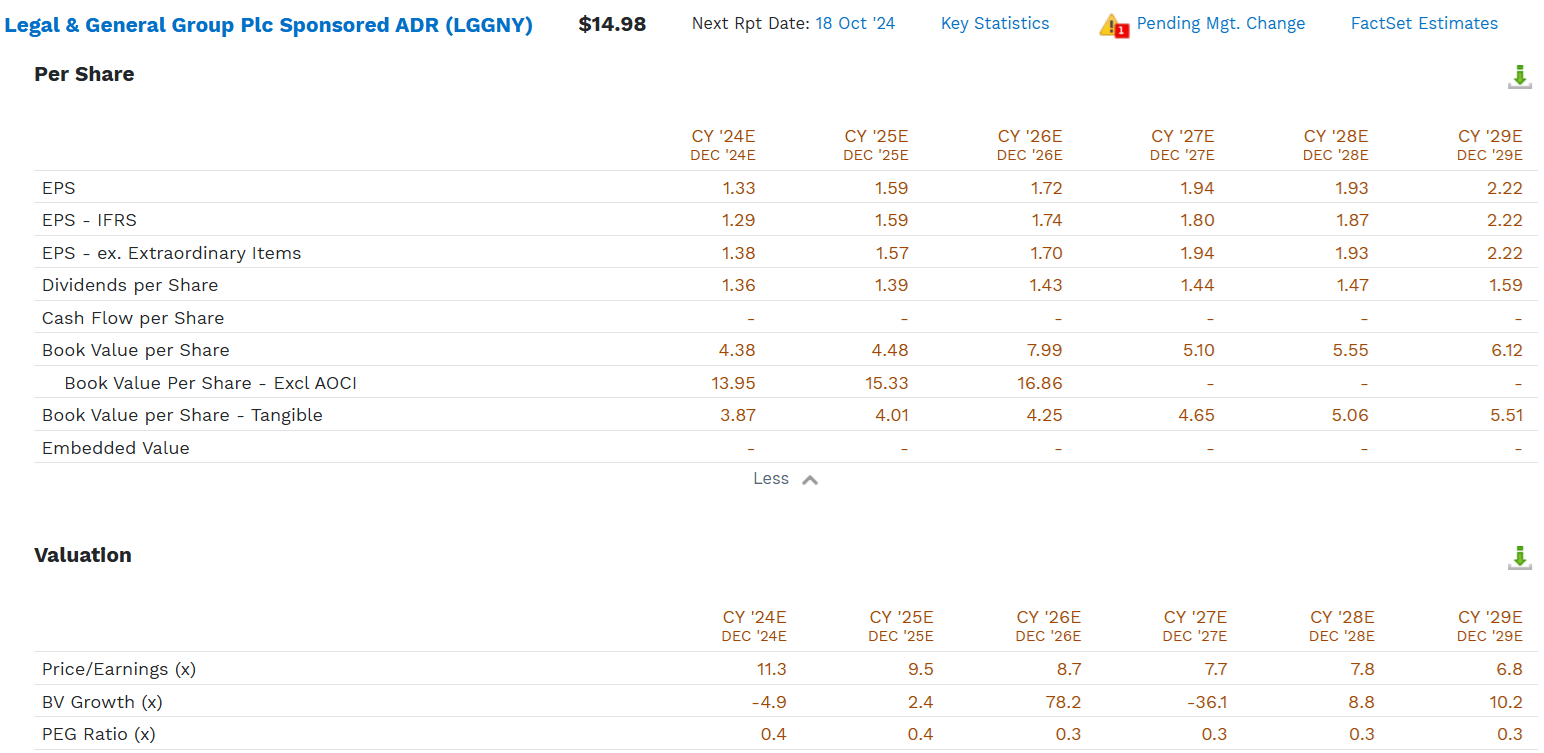
LGGNY’s payout ratio is expected to remain elevated for several years,
- 2024: 102%
- 2025: 87%
- 2026: 83%
- 2027: 74%
- 2028: 76%
- 2029: 72%
LGGNY has a new business model (it sold its legacy insurance to Allianz in 2019) and annuity is more stable than traditional insurance. However, a 70% payout ratio is still unsafe when EPS can fall 25% to 50% annually.
This A-credit rating company could sustain a year or two of payout ratios above 100%. Still, rating agencies could eventually pressure it to cut if it falls into a sustained earnings recession.
And don’t forget that every individual company has individual company risk.
The S&P will always recover eventually, barring the permanent destruction of the US and global economy.
No portfolio can protect against the apocalypse.
Wide Moat Research 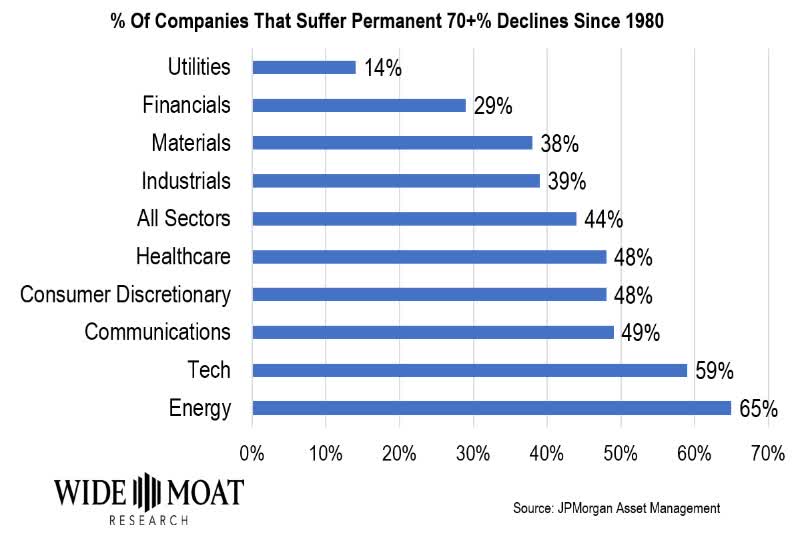
Individual companies don’t often recover from catastrophic declines.
Our comprehensive safety and quality model uses over 1,000 metrics to measure income dependability and overall company risk.
Avoiding permanent catastrophic declines of 70+% is critical to long-term success.
But even if you own an Ultra Sleep Well at Night Aristocrat, like MO, volatility will still be present.
Portfolio Visualizer 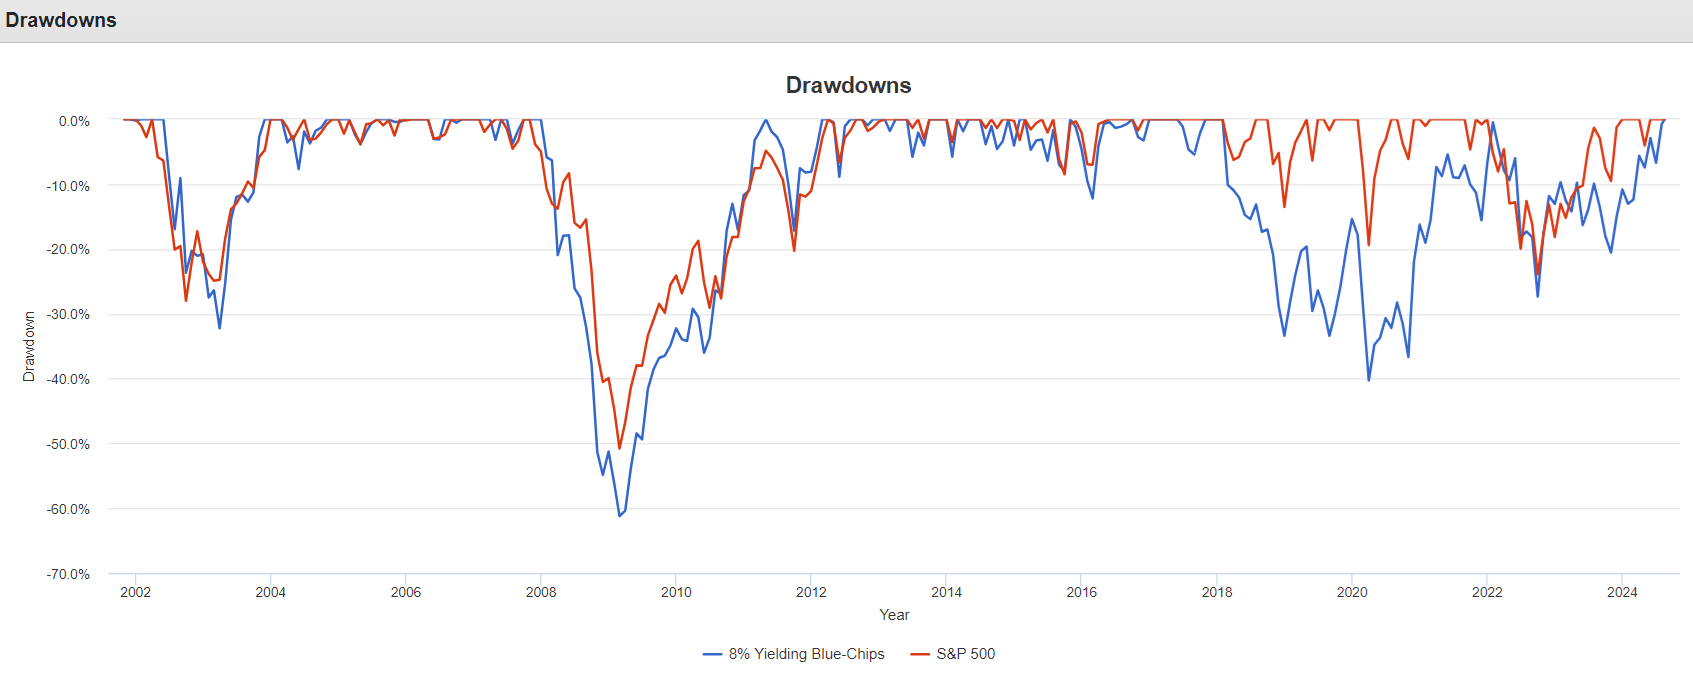
These high-yield blue chips can be more volatile than the S&P, creating some major bear markets you must be willing to ride out.
Portfolio Visualizer 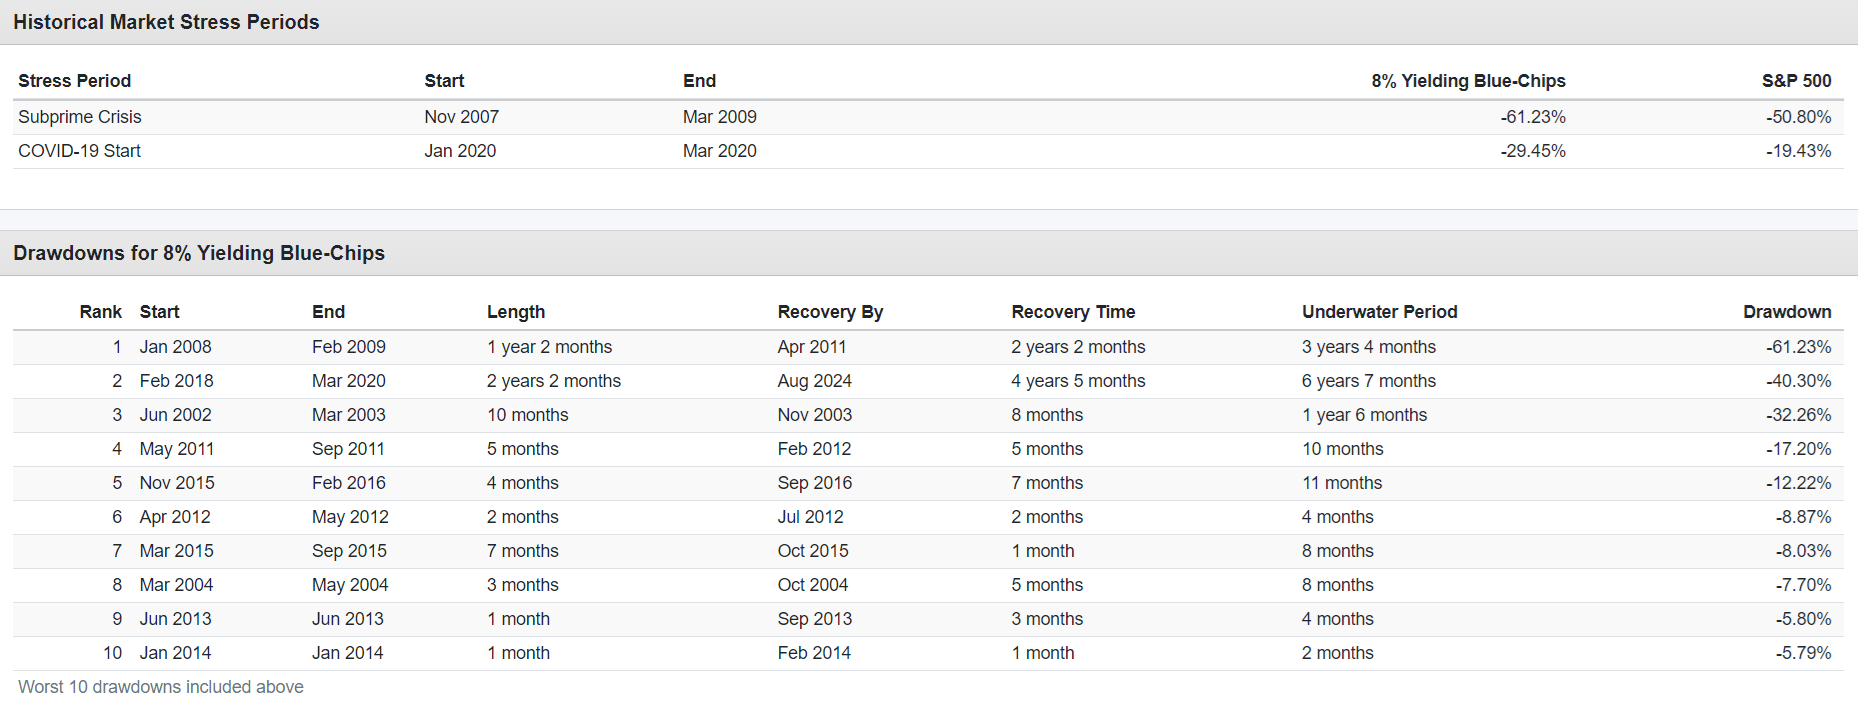
Worst 10% of Months Since 2001
| 8% Yielding Blue-Chips | S&P 500 | ||
| Year | Month | Return | Return |
| 2008 | 10 | -21.83% | -16.52% |
| 2002 | 9 | -16.04% | -10.49% |
| 2020 | 3 | -16.00% | -12.46% |
| 2008 | 3 | -15.61% | -0.90% |
| 2020 | 2 | -13.50% | -7.92% |
| 2022 | 6 | -13.06% | -8.25% |
| 2019 | 5 | -12.37% | -6.38% |
| 2009 | 2 | -11.33% | -10.74% |
| 2022 | 9 | -11.20% | -9.24% |
| 2009 | 1 | -10.30% | -8.21% |
| 2018 | 2 | -10.12% | -3.64% |
| 2018 | 11 | -10.03% | 1.85% |
| 2008 | 6 | -10.00% | -8.35% |
| 2002 | 7 | -9.28% | -7.88% |
| 2008 | 9 | -8.54% | -9.44% |
| 2002 | 6 | -8.50% | -7.38% |
| 2012 | 5 | -8.43% | -6.01% |
| 2003 | 1 | -8.42% | -2.46% |
| 2003 | 3 | -7.98% | 0.20% |
| 2010 | 5 | -7.91% | -7.95% |
| 2011 | 9 | -7.68% | -6.94% |
| 2020 | 10 | -7.55% | -2.49% |
| 2023 | 5 | -7.27% | 0.46% |
| 2008 | 11 | -7.24% | -6.96% |
| 2018 | 12 | -6.41% | -8.79% |
| 2008 | 8 | -6.15% | 1.55% |
| 2019 | 8 | -6.05% | -1.67% |
| 2011 | 8 | -5.88% | -5.50% |
| Average | -10.17% | -6.16% | |
| Median | -8.91% | -7.17% |
(Source: Portfolio Visualizer)
Best 10% of Months Since 2001
| 8% Yielding Blue-Chips | S&P 500 | ||
| Year | Month | Return | Return |
| 2020 | 11 | 23.20% | 10.88% |
| 2009 | 4 | 16.42% | 9.93% |
| 2009 | 7 | 15.29% | 7.46% |
| 2022 | 10 | 13.38% | 8.13% |
| 2010 | 9 | 13.34% | 8.96% |
| 2003 | 5 | 13.07% | 5.48% |
| 2004 | 11 | 12.74% | 4.45% |
| 2009 | 5 | 11.75% | 5.85% |
| 2011 | 10 | 11.65% | 10.91% |
| 2010 | 7 | 11.03% | 6.83% |
| 2011 | 4 | 10.90% | 2.90% |
| 2021 | 12 | 10.34% | 4.63% |
| 2003 | 4 | 10.27% | 8.46% |
| 2012 | 2 | 9.73% | 4.34% |
| 2015 | 10 | 9.71% | 8.51% |
| 2021 | 3 | 9.68% | 4.54% |
| 2003 | 10 | 9.61% | 5.35% |
| 2002 | 8 | 9.52% | 0.68% |
| 2020 | 4 | 9.24% | 12.70% |
| 2016 | 3 | 9.19% | 6.72% |
| 2014 | 2 | 8.78% | 4.55% |
| 2011 | 2 | 8.62% | 3.47% |
| 2002 | 5 | 8.60% | -0.59% |
| 2012 | 6 | 8.57% | 4.06% |
| 2003 | 12 | 8.31% | 5.03% |
| 2008 | 12 | 8.04% | 0.98% |
| 2019 | 1 | 7.89% | 8.01% |
| 2024 | 3 | 7.71% | 3.27% |
| Average | 10.95% | 5.95% | |
| Median | 9.72% | 5.42% |
(Source: Portfolio Visualizer)
Statistically speaking, you should expect one month to be up or down 10% to 11% at least once per year.
(Source: Portfolio Visualizer)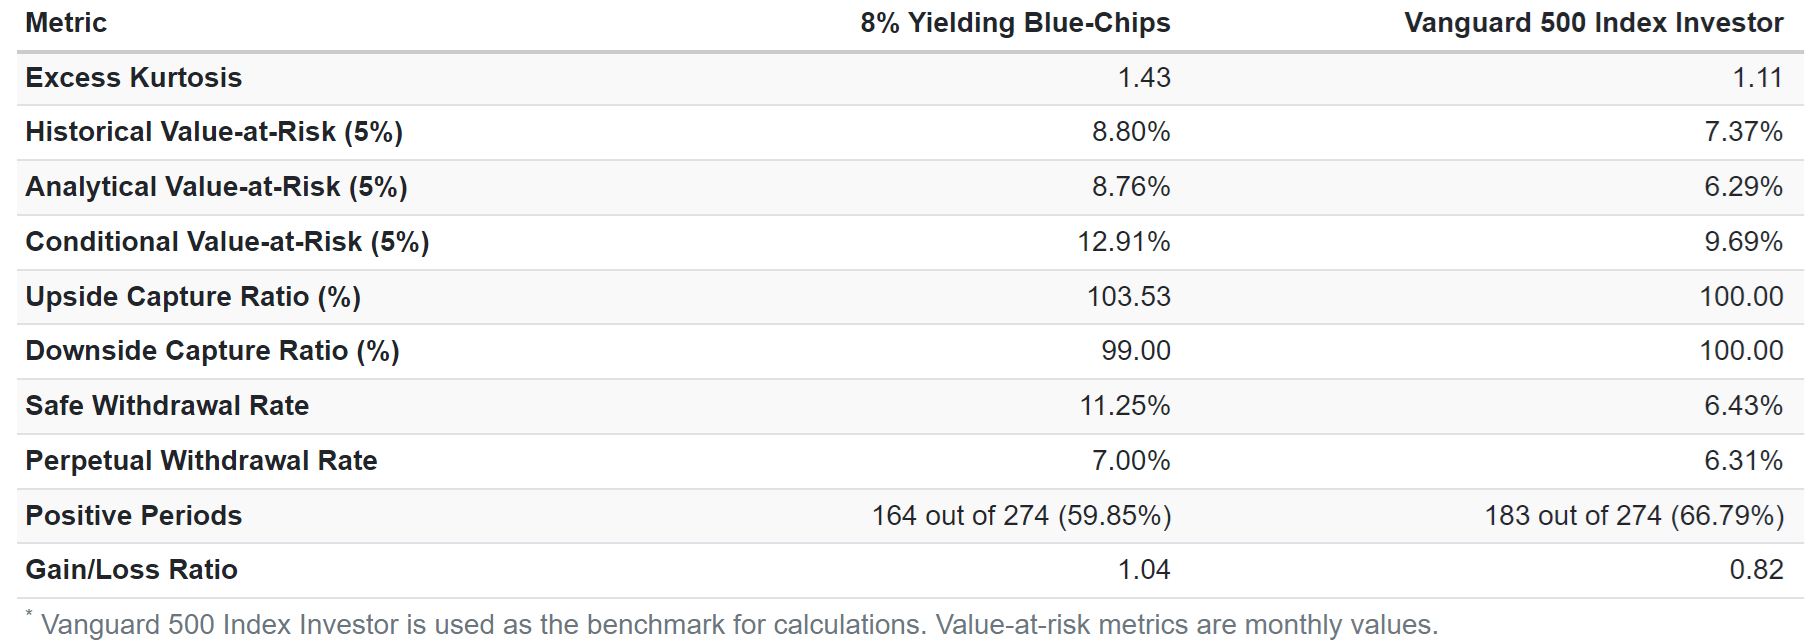
Since 2001, these 8% yielding blue chips have delivered 104% of the S&P’s upside in rising markets and 99% of the downside in falling ones.
But of course, some of those worst months occurred during months when the S&P was flat for up.
When the market was up 2%, there was as much as a 10% decline for a 12% monthly underperformance.
In other words, never forget that owning individual stocks and portfolios that look nothing like the S&P will result in tracking error.
It’s a feature, not a bug, but some investors will experience market envy or FOMO and quit in disgust, which can lead to costly losses in high-yield blue-chip investing.
High-yield blue chips are never a bond alternative. Junk bond alternatives? Sure, they could serve as a reasonable alternative to junk bonds if you remember that bonds are first in the capital structure of companies (so the fundamental risk of losing 100% of your money is much lower). High-yield stocks are much more volatile than junk bonds.
However, avoiding major market declines requires smart asset allocation depending on your financial and emotional risk tolerance.
Bottom Line: Don’t Give Into Market Fear, There’s Always Something Great To Buy Even With The Market At Record Highs
These 8% yielding blue chips showcase that it’s always and forever a market of stocks, not a stock market.
If you don’t buy into the growth stock hype? Don’t think that AI will drive 12%-plus long-term growth for the S&P? You can make a prudent bet that 8% yielding blue-chips growing dividends at 5% to 8% over time will deliver great returns and the income you need to retire in comfort and dignity, and possibly, safety and splendor.
Editor’s Note: This article discusses one or more securities that do not trade on a major U.S. exchange. Please be aware of the risks associated with these stocks.