-Oxford-
I last wrote about FedEx (NYSE:FDX) about a year ago. My investment thesis was bullish, and it remains so today.
I became constructive on FedEx common shares beginning January 2019. Since my first FDX article was published, the stock has done well despite considerable turbulence due to the pandemic, new senior management, and a corporate structure overhaul.
seekingalpha.com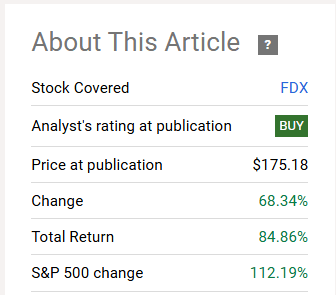

In this article, we will:
-
revisit and drill into the investment thesis
-
identify several key go-forward metrics to monitor
-
set a new Fair Value price target
FedEx Investment Thesis
FedEx remains a solid, long-term investment for the following reasons:
-
management is implementing new strategies successfully and obtaining results, despite a generally uncooperative operating environment
-
the balance sheet remains sound
-
operating margins, a key business driver, are improving
-
a general upturn in the economic business cycle coupled with ongoing cost reductions are likely catalysts to drive the stock higher
Drilling Down a Bit Deeper
The DRIVE Initiative: A Change in Direction
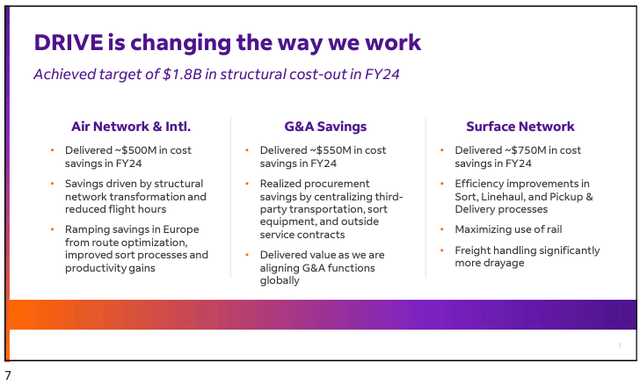
Introduced in 2023, the DRIVE initiative is a corporate prime mover. It’s a comprehensive, global program designed to improve the company’s long-term profitability. The DRIVE program includes a business optimization plan to increase efficiency while decreasing costs. It utilizes automation to transform back-office operations and modernize infrastructure.
In FY2024 (ending in May) management reported DRIVE delivered $1.8 billion in structural cost-out.
The results are not smoke and mirrors. In 2024, year-over-year total operating costs fell $3.1 billion. The figure includes $580 million business optimization and realignment expenses.
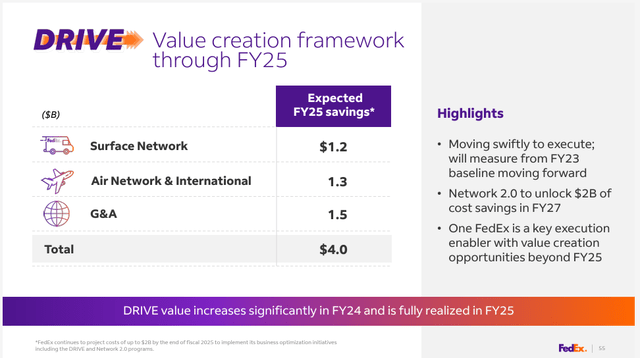
Management states by the end of FY2025, the DRIVE program will permanently remove costs totaling $4 billion.
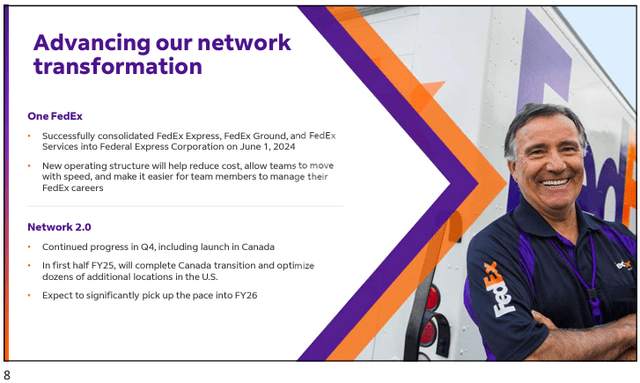
One FedEx and Network 2.0 are the centers of gravity for DRIVE.
One FedEx combines FedEx Express, FedEx Ground, and FedEx Services into Federal Express Corporation.
Current CEO Raj Subramaniam championed this cause. Fred Smith, FedEx founder and its only previous CEO, was not keen to make the move. After Subramaniam succeeded Smith in 2022, he pushed the change forward.
The consolidation was completed on June 1, 2024.
In addition, Network 2.0 is a multi-year effort to improve how FedEx pick-ups, transports, and delivers packages.
Network 2.0 intends to:
-
streamline and simplify package pickups and deliveries with one van in one neighborhood.
-
improve speed and service by consolidating stations and decreasing package hand-offs.
-
use the same technology throughout the company.
-
improve customer support.
Network 2.0 is expected to reduce expenses by an additional $2 billion by FY2027.
FedEx Owns a Sound Balance Sheet
FedEx is a solid, ‘BBB’ investment-grade company. Typical balance sheet metrics including the current ratio, net debt ratio, and interest coverage ratio are acceptable.
Margins Are Improving
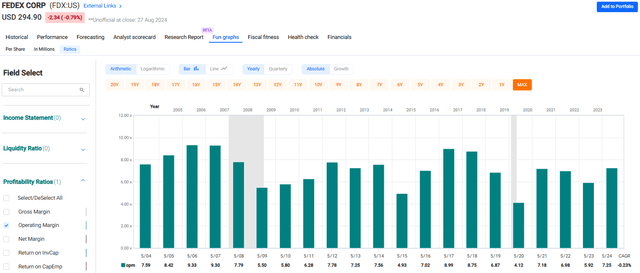
FedEx runs in a cyclical business environment. Margins are the lie detector.
In recent years, FedEx has been operating in a less-than-robust economic backdrop. Operating margins have been limping along.
However, the situation is changing. A combination of management initiatives and improving growth prospects are seeing corporate margins moving off their lows.
Historically, at top cycle, FedEx enjoys ~9 percent margins. Management believes 10 percent margins are attainable via the structural changes being implemented.
Drilling down further, the most problematic segment has been FedEx Express. In FY2023, operating margins tumbled to 2.5% from 6.5% a year earlier; they’ve remained stubbornly low. The One FedEx initiative is intended to fix FedEx Express.
Summary
FedEx is at a crossroads featuring several positive factors.
At a high level, the U.S. and EU markets have been under economic pressure. This pressured FedEx growth and returns. More recently, I believe lower interest rates are likely to provide a boost to economic activity.
At the corporate level, a new CEO and his staff have re-imagined longstanding FedEx strategies and structure. There is an urgency, thus far demonstrably successful, to streamline operations and reduce costs. Such reduction includes operating expenses as well as capital intensity.
I believe a combination of the macro and micro will become dual catalysts to push FDX stock higher. While secondary, FedEx also pays a dividend. The current yield is just 1.9 percent; however, over the past five years, the dividend growth rate is about 14 percent a year.
Risks to the thesis include:
-
continued uncooperative economic business climate; thereby crimping package transportation demand and operating margins
-
failure of the current management team to successfully implement DRIVE; including the One FedEx, and Network 2.0 initiatives
-
general business disruption by new entrants, specifically, Amazon, Inc. (AMZN)
A Few Words on Amazon
There’s been a lot of ink spilled, fretting that Amazon will move into FedEx turf and create a price war.
It’s true Amazon is one of the biggest brands and is the third-largest courier in the United States after UPS and the USPS. But will they try to go toe-to-toe with FedEx?
I don’t think so.
First, FedEx has a relatively wide moat. It is easier to manage package logistics when you have control over the shippers (i.e., Fulfillment By Amazon), but less so when the network must perform a focused, B2B on-demand service. In other words, Amazon and FedEx logistics services are not clean overlaps.
Second, contract drivers are integral to FBA and FedEx. However, contract driver revenue generation is almost diametrically opposed. Here’s an excerpt from an informative article about the topic:
FedEx Ground routes are a guaranteed revenue stream. Daily, FedEx Ground contractors have an idea of how many stops they have to make or the number of miles to complete. This means contractors can expect a certain amount of total revenue each month. Amazon DSP [Delivery Service Partner] routes are the opposite. Amazon provides only a prediction of the number of routes or miles to complete, which varies week to week, and results in inconsistent revenue. For example, one week a DSP could utilize 50 trucks and drivers while the following week they only have enough work for 20 trucks and drivers. This business model creates challenges for DSPs because they can have too many employees for one week and not enough team members the following week.
It seems unlikely Amazon can dislodge FedEx Ground with its current business model.
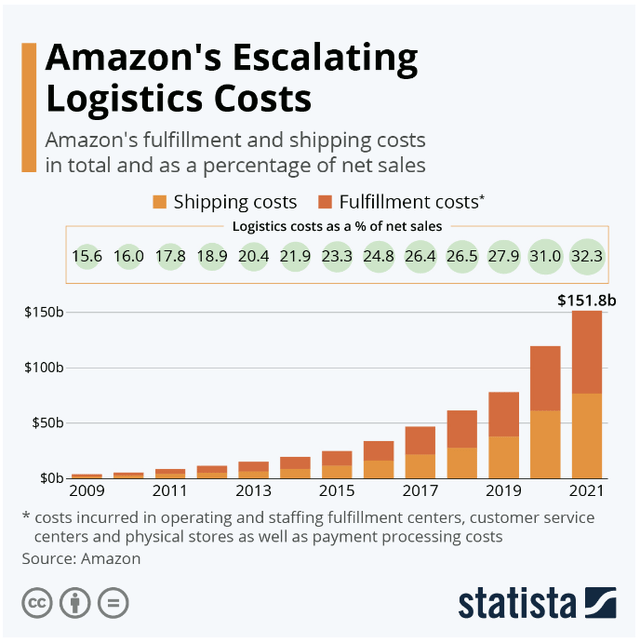
Third, high entry costs challenge the package transportation and logistics business. Here’s a chart illustrating how much Amazon is spending to develop a delivery business for their own products:
Yes, Amazon package volume is increasing rapidly. However, the chart above highlights logistics costs as a function of sales continues to escalate in spite of greater volume. This chart runs through 2021.
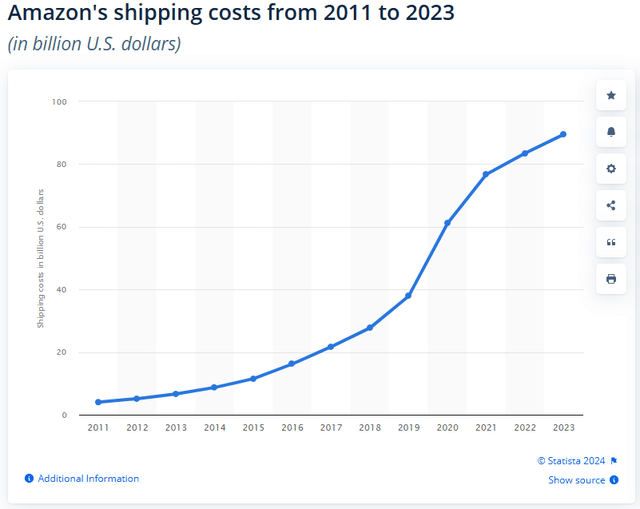
Since 2021, Amazon logistics expenses continue to rise. Here’s another Statista.com chart (through 2023) showing Amazon shipping costs only (fulfillment costs not included).
Meanwhile, FBA shippers are paying fees that far outstrip inflation.
Indeed, the package transportation / logistics business isn’t an easy one.
Fourth, the FedEx business model is honed upon scale and efficiency. Nonetheless, margins tend to be cyclical and relatively low. Why would Amazon want to employ the expense and capital required to compete with FedEx and United Parcel Service (UPS)?
Amazon’s current U.S. retail operating margins are no better than FedEx’s. Moving packages around is highly unlikely to improve margins.
I believe Amazon will stick to knitting.
FedEx Metrics: What to Watch
FedEx provides investors exhaustive operating and financial statistics. Management does a fine job presenting current information and historical data. I seek to funnel it down.
Broadly, business success is pegged to margins, volume, and efficiency.
I offer you three metrics I believe are a great place to start when evaluating business performance:
Operating Margins
Earlier in this article, we touched upon the importance of operating margins. These tie together multiple parts of the business. In FY2024, the operating margin was 7.25 percent, besting 2023 by 133 bps. 4Q2024 adjusted margin reached 8.5 percent.
Historically, FedEx has attained ~9 percent margins. Given management’s renewed focus on cost control and efficiency, top-cycle 10 percent margins are considered achievable.
Package Volume
FedEx provides detailed operating data, including package volumes. Going forward, the One FedEx program will consolidate FedEx Express and FedEx Ground volumes. Currently, I believe package volumes are around cyclical lows. As these volumes increase, it will signal a strengthening economy and lead to stronger FDX earnings and cash flow.
It’s also advisable to keep an eye on package yield. In recent quarters, package yields have been improving. See the charts below.
investors.fedex.com investors.fedex.com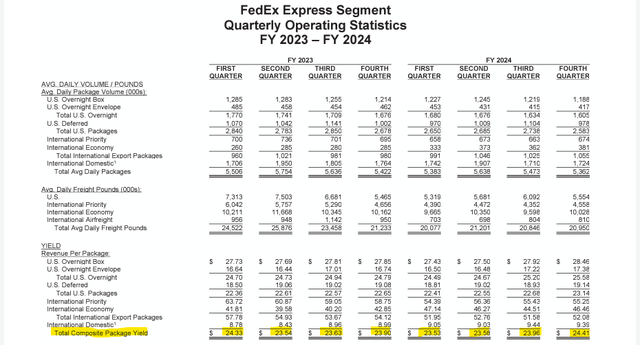


Asset Utilization
Asset utilization is an efficiency metric. It’s calculated by viewing revenue as a function of total assets.
Here’s FedEx efficiency ratio between FY2018 to FY 2024.
FedEx Asset Utilization Ratio – FY 2018 thru FY 2024 ($B and Ratio %)
|
2024 |
2023 |
2022 |
2021 |
2020 |
2019 |
2018 |
|
|
Revenue |
87.7 |
90.2 |
93.5 |
84.0 |
69.2 |
69.7 |
65.5 |
|
Assets |
87.0 |
87.1 |
86.0 |
82.8 |
73.5 |
54.4 |
52.3 |
|
Utilization |
1.01 |
1.04 |
1.09 |
1.01 |
0.94 |
1.28 |
1.25 |
Note, while 2024 margins moved up, asset utilization did not.
Taking a long view, the pandemic marked a steep drop in asset utilization efficiency. It has not recovered. However, cost control, business consolidation, network efficiency, focus upon profitable growth, and an inevitable economic upswing are all drivers that are likely to enable FedEx to enjoy better asset utilization. Keep an eye on this one.
FedEx Fair Value
Over the past few years, FDX shareholders have enjoyed a good run. While FedEx stock is no longer inexpensive, it remains a reasonable purchase for patient long-term investors.
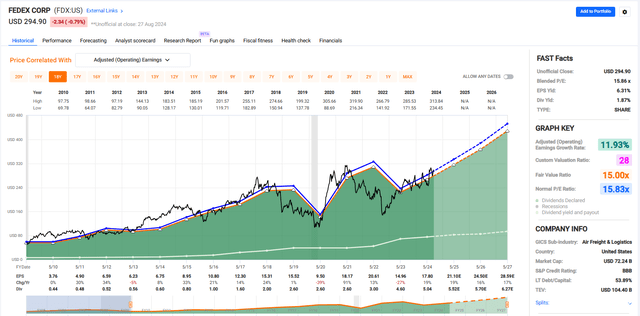
Let’s begin with a post-Great Recession FAST Graph highlighting price-and-earnings:
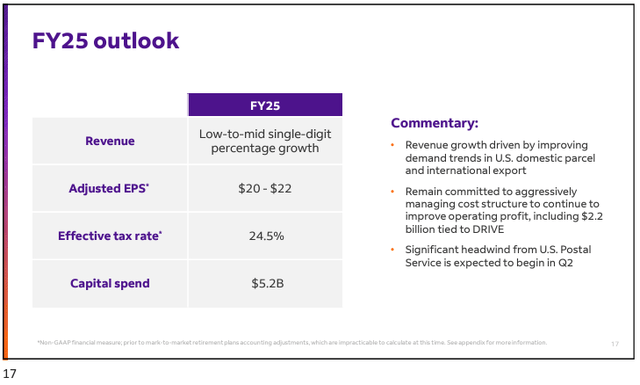
For FY 2025, FedEx management guides investors to a midpoint $21.00 EPS.
Placing an historical 16x P/E on management’s guidance indicates a $336 stock.
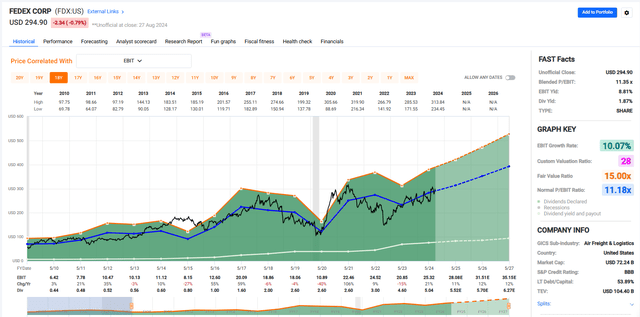
Turning to EBIT (operating earnings) here’s another long-term chart:
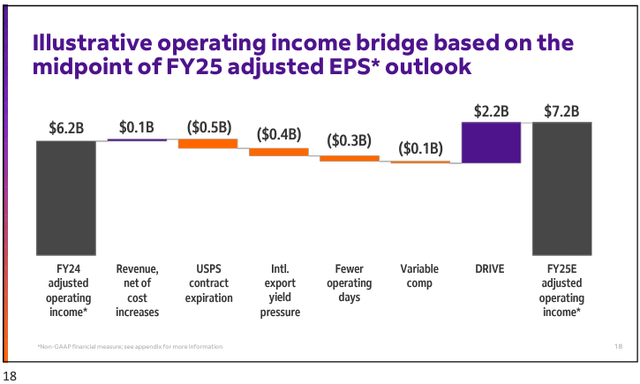
Management provided FY2025 EBIT guidance ~$30 a share.
Applying an historical 11x multiple suggests a $330 stock.
When evaluating these P/E or P/EBIT valuations, please note forward growth rates per share are projected to be greater than the long-term average growth rates.
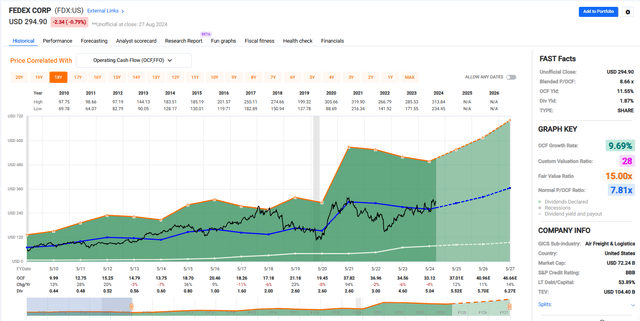
Next, here’s a P/OCF (Operating Cash Flow) chart.
Using current 2025 Street OCF estimates and a 8x valuation ratio, we obtain a $296 FVE.
Blending the three markers, my current FVE is ~$326. That’s about 11 percent above the recent FDX bid; tight for my usual >20 percent factor of safety.
Notably, the most recent earnings release juiced FDX prices, and the shares have remained elevated. Nonetheless, after due diligence, long-term investors may consider opening a small starter position and wait for a general market pullback.
Since 1950, overall market returns in September have averaged -0.8 percent, easily the weakest month of the year.
Please do your own careful due diligence before making any investment decision. This article is not a recommendation to buy or sell any stock. Good luck with all your investments.

