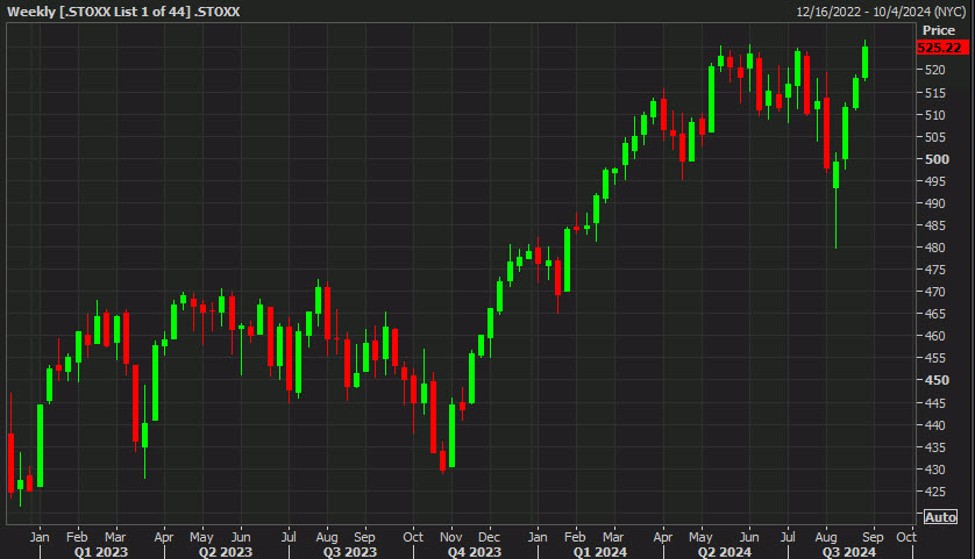
The stock market did a remarkable job recovering from an early August sell-off. Carrying that momentum into September will be difficult, however, if history is any guide. Data from the Stock Trader’s Almanac shows September has been the worst month for the S & P 500 since 1950. In that time, the broad market index has averaged a 0.7% loss every September. Over the past 10 years, the S & P 500’s performance for the month is even worse. FactSet data shows the S & P 500 has lost 2.3% on average over the last 10 Septembers. It’s also fallen for four straight years in the month. “It’s important to bear in mind seasonality,” said Steve Sosnick, chief strategist at Interactive Brokers. “It doesn’t mean we go down in September once again, but the odds say that a little more caution is warranted.” Sosnick said this is a good time to “opportunistically buy volatility” as a hedge against the seasonal pressures. .SPX 1M mountain SPX 1-month chart One vehicle investors can use here is the ProShares Ultra VIX Short-Term Futures ETF (UVXY) , which offers leveraged exposure to short-term VIX futures. The fund charges 0.95% in fees. This hedge could be helpful given that some members of the artificial intelligence trade have a history of underperformance in September. Advanced Micro Devices has averaged a 6.2% decline in September over the past 10 years, while Nvidia has lost 1.2%. Meta Platforms, meanwhile, has shed an average of 4% in September. “This is a seasonal time where not every dip is a buying opportunity and where not every rally deserves to be chased,” said Sosnick.
Subscribe to Updates
Get the latest tech, social media, politics, business, sports and many more news directly to your inbox.


