Bitcoin is firm at press time, finding support from around the $56,300 to $57,000 zone, looking at the performance in the daily chart. Technically, sellers have the upper hand from an effort-versus-result perspective.
For the short-term trend to change, prices must peel back the losses of September 1. At the same time, the leg up must be with expanding trading volume.
Currently, Bitcoin might be steady. However, the accompanying engagement, looking at the September 2 bar, is light.
What’s required is a sharp uptick in trading volume to assuage fears and assure optimistic traders that buyers are back in the picture.
Bitcoin Expands, Puell Multiple Ratio In Neutral Zone
Even as Bitcoin tries to find its footing, one analyst, citing on-chain data, thinks it is too early to celebrate. The expansion today didn’t rapidly lift the Puell Multiple plotted by CryptoQuant.
The reading stands at 0.65 and is within the 0.6 and 0.8 range. At this zone, Bitcoin remains neutral. As such, the Puell Multiple reading needs to rapidly expand above 0.8 or drop to the 0.6 zone for traders to explore opportunities.
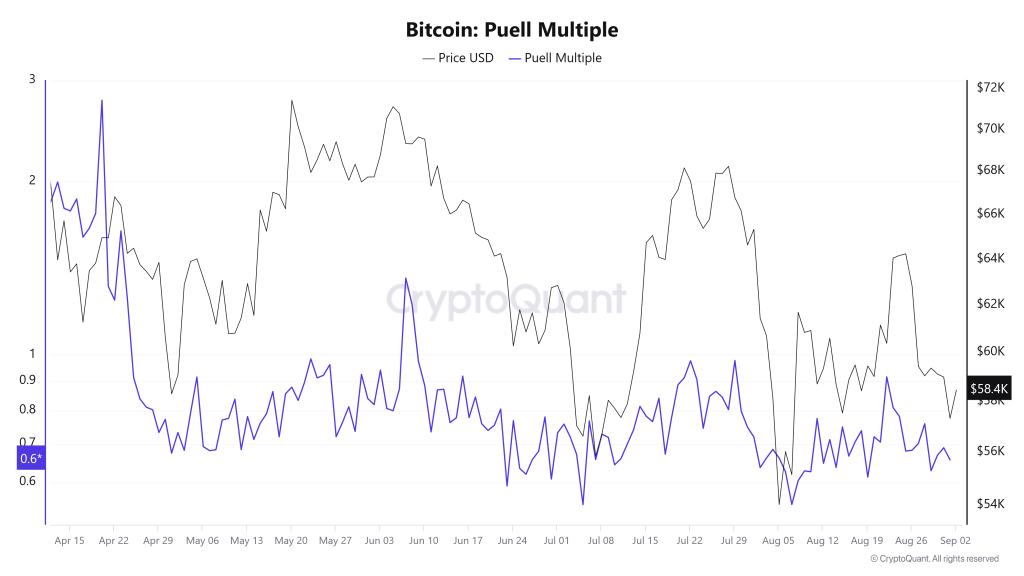
The Puell Multiple compares the value of BTC issued daily versus its yearly average. Considering that issuance changes over the months, this reading fluctuates. In the past few months, and after the Halving event on April 20, the Puell Multiple has been in a tight range between 0.6 and 0.8.
Pointing to historical formation, aggregated over the last decade, the analyst said that whenever the Puell Multiple ratio drops below 0.6, it tends to offer low-risk, high-reward buying opportunities that could particularly benefit those who use Dollar-Cost Averaging (DCA) strategies.
Conversely, if the ratio surges above 0.8, it means the market sentiment is bullish, and prices could tear even higher. In most cases, the analyst added, whenever the ratio surges above 0.8, prices tend to rally, registering fresh all-time highs.
Bitcoin Building Bullish Momentum?
Looking at the Puell Multiple ratio trend versus price action, it is easy to pick out their near-perfect sync.
For instance, when prices plunged to as low as $49,000 on August 5, the Puell Multiple ratio, being a lagging tracker, crashed to 0.549. Afterward, prices rose, lifting the ratio.
The recovery from the 0.60 zone is noteworthy. If this guides, it could also mean that the coin, though bearish, is presently building up momentum.
Feature image from Pexels, chart from TradingView