Data shows that Bitcoin sentiment is almost in the extreme fear zone. Here’s what this could mean for the asset’s price.
Bitcoin Fear & Greed Index Is Currently Sitting Deep Inside ‘Fear’
The “Fear & Greed Index” is an indicator created by Alternative that tells us about the general sentiment among the investors of Bitcoin and other top cryptocurrencies.
The index represents the sentiment as a score on a scale between zero to hundred, which it determines using the following five factors: volatility, trading volume, social media sentiment, market cap dominance, and Google Trends.
When the indicator has a value greater than 53, the traders share a sentiment of greed. On the other hand, it being under 47 implies the presence of fear in the market. Naturally, the region between the two cutoffs corresponds to a net-neutral mentality.
Now, here is where the Bitcoin market stands right now according to the Fear & Greed Index:
Looks like the index has a value of 26 at the moment | Source: Alternative
As is visible above, the Bitcoin Fear & Greed Index has a value of 26 right now, which means the market is deep into the fear zone. The metric is right on the boundary of a special region known as extreme fear.
Extreme fear occurs when the indicator reaches a value of 25 or lower and represents a state of immense distress among investors. A similar but opposite zone for the greed side, called extreme greed, occurs at 75 and higher.
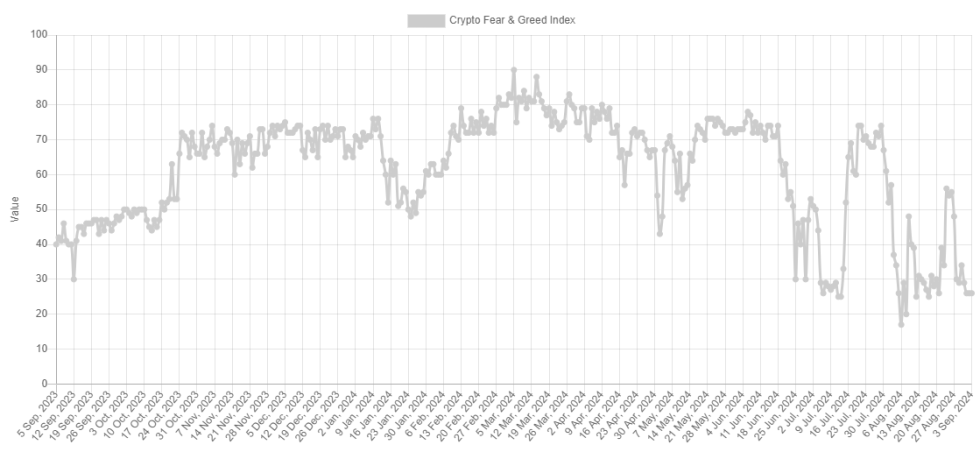
The latest market sentiment contrasts to that only around a week ago, when the index still signals “greed values.” The below chart shows how the indicator’s value has changed over the past year.
The value of the metric appears to have been relatively low recently | Source: Alternative
The current fearful market is natural because Bitcoin has registered another drop, with its price slipping under $58,000 this time. If history is anything to go by, this development may not be entirely bad for the asset.
BTC has tended to move in the opposite direction from what the majority expect, and the probability of such a contrary move has only increased the more the investors have become sure of the asset’s direction.
This expectation is the strongest inside the extreme sentiment zones, so it’s no surprise that major tops and bottoms have generally formed when the index has been in these regions.
Since the Fear & Greed Index has been on the edge of the extreme fear zone during the last few days, a fall may occur in the coming days, leading towards a potential bottom for Bitcoin. That is only if the price doesn’t show a sudden sharp turnaround from here.
BTC Price
Bitcoin had recovered above $59,000 earlier in the day, but the recovery was quite short-lived as it is already down to $57,700.
The price of the asset appears to have plunged | Source: BTCUSD on TradingView
Featured image from Dall-E, Alternative.me, chart from TradingView.com