Fundamental
Overview
The US Dollar has come back
under pressure recently as we got a couple of soft US data. The US ISM Manufacturing PMI disappointed the market as it came
lower than expected and the new orders index dropped further into contraction.
The US Job Openings yesterday showed some more cooling
as the data missed expectations by a big margin. The Treasury yields fell as a
consequence and weighed on the greenback.
In fact, the recent
appreciation of the AUD has been mostly driven by the US Dollar side of the
equation. From a monetary policy perspective, there’s now a 50/50 chance of
either a 25 or 50 bps cut at the upcoming FOMC meeting, so the NFP report
tomorrow will decide by how much the Fed is going to cut. For the RBA, the market sees a 93%
probability of no change at the upcoming meeting with a total of 20 bps of
easing by year-end.
AUDUSD
Technical Analysis – Daily Timeframe
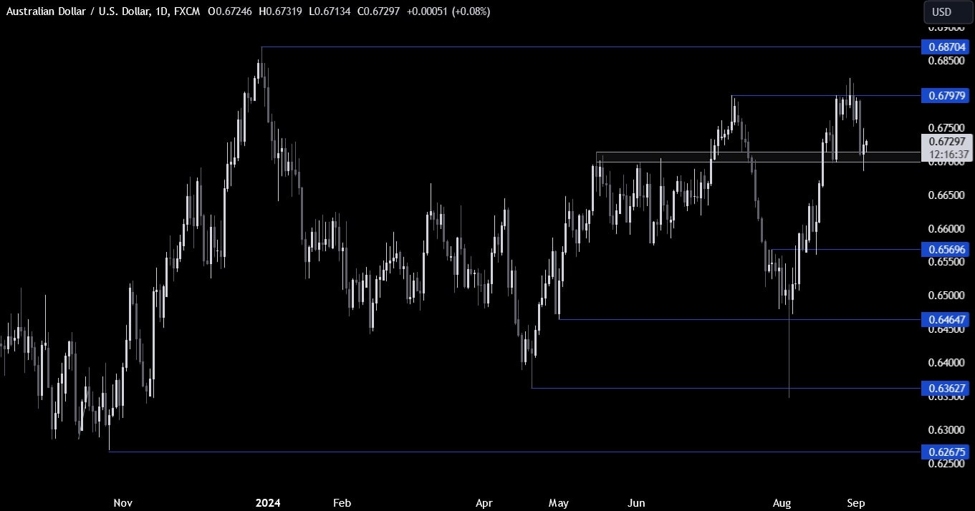
AUDUSD Daily
On the daily chart, we can
see that AUDUSD probed above the 0.68 handle but eventually dropped all the way
back to the key support
zone around the 0.67 handle. This is where we can expect the buyers to pile in
with a defined risk below the support to position for a rally into new highs.
The sellers, on the other hand, will want to see the price breaking lower to
increase the bearish bets into the 0.60 handle next.
AUDUSD Technical
Analysis – 4 hour Timeframe
AUDUSD 4 hour
On the 4 hour chart, we can
see that we have a downward trendline defining the current bearish
momentum. We can expect the sellers to lean on it with a defined risk above it
to position for a break below the 0.67 support. The buyers, on the other hand,
will want to see the price breaking higher to increase the bullish bets into
the 0.6870 level.
AUDUSD Technical
Analysis – 1 hour Timeframe
AUDUSD 1 hour
On the 1 hour chart, there’s
not much else we can glean from this timeframe other than waiting for the reaction
around the trendline or a break below the support. The red lines define the average daily range for today.
Upcoming
Catalysts
Today we have the US ADP, the US Jobless Claims and the US ISM Services PMI.
Tomorrow, we conclude the week with the US NFP report.