bitcoin daily
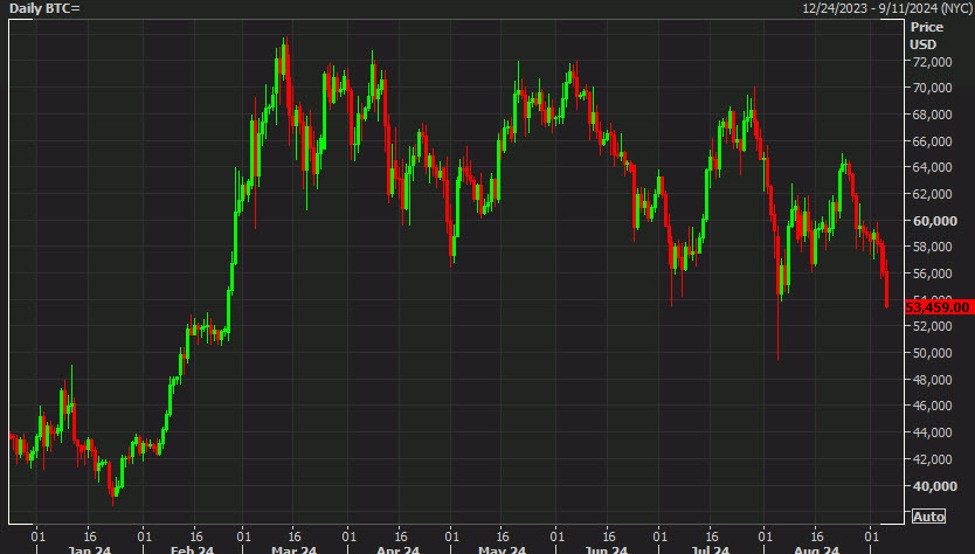
There aren’t many charts more technical than bitcoin and with today’s 4.5% decline, it’s sending all the wrong signals.
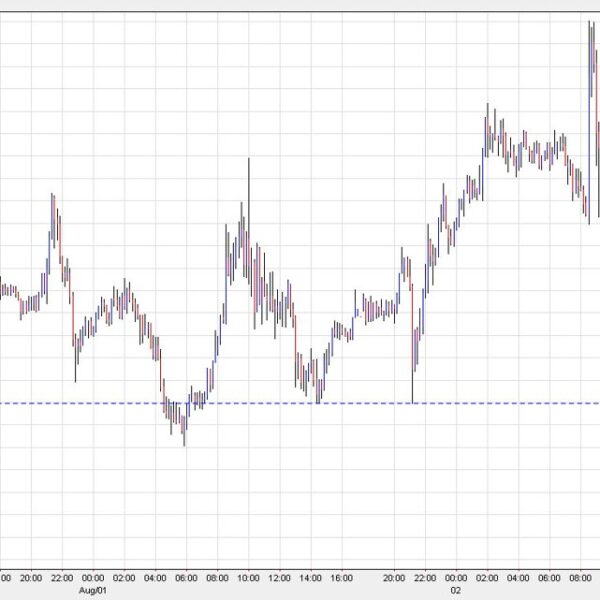
It’s only been below these levels for a few hours over the past six months and the last time it was here it was flushed down to $50,000 in something of a flash crash.
At the same time, the series of lower highs from $72K down to 65K over the past six months sends the wrong signal.
Moreover, there is a strong correlation between bitcoin and tech stocks, particularly semiconductors. That space is suddenly struggling as the market cools on its enthusiasm for AI. Broadcom reported results yesterday and is down nearly 10% today while Nvidia is down 4.5%.