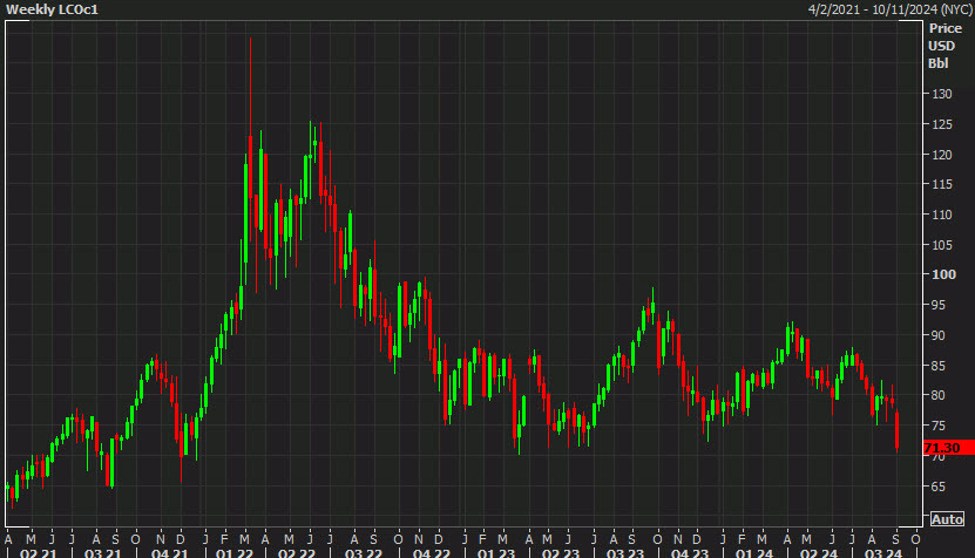
WTI crude is still clinging to support but the picture is looking increasingly dire for brent. The global benchmark closed today at the lowest since December 2021.
There have been a series of daily lows right around these levels and there are intraday lows that are worse since 2021 but this is the lowest daily and weekly close. That’s not a good sign.
Brent weekly
I’d argue that the physical picture isn’t this bad, as we’ve seen hefty draws in US supplies and draws in global inventories. I think the market is anticipating a global growth slowdown and selling based on that as well as the likelihood of global production oversupply in H1 2025.
I think it’s also worth zooming out to the monthly chart to highlight the narrow range over the past two years. That’s indicative of a managed market which is exactly what OPEC has been doing. At the same time, it’s a reminder that OPEC hasn’t been great at managing the market over the past 25 years.
It’s also a reminder that brent is where it was in 2006. However when you adjust for inflation, $71 in 2006 is $109.50 today.
Even going back to just December 2021, the total inflation has been 20.25%, which makes $71 equal to $85.
That highlights just how much the price of a barrel has fallen in real terms, something that’s largely due to the US shale revolution but also underscores that it will be tough to make money in conventional oil from here against a backdrop of 3-6% annual global decline rates.
Further, adjusting the July 2008 all-time high of $147.50 to current dollars would yield $210.92 — an unfathomable sum.
The trouble for oil bulls right now is that any further selling opens up an ugly technical picture that could pave the way back to $60 and some uncomfortable decisions for producers.