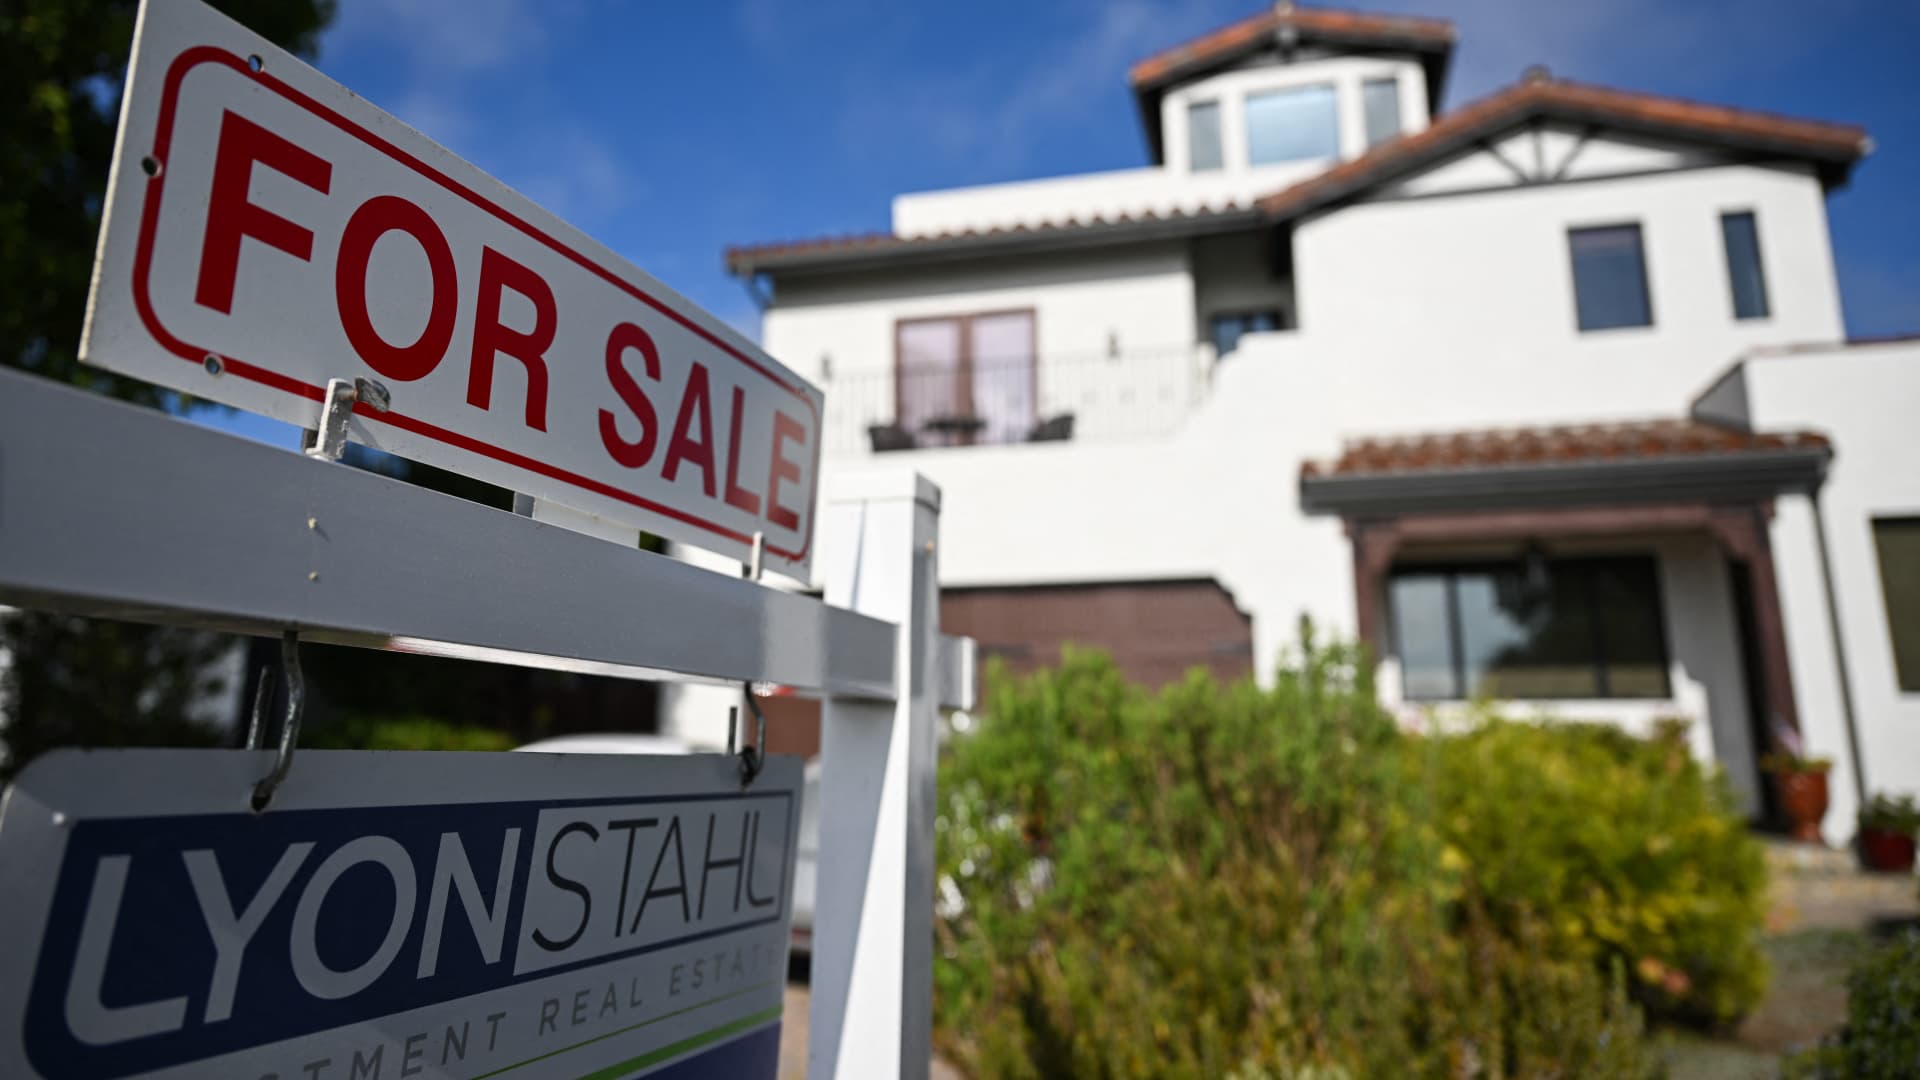
A for sale sign is displayed outside of a home for sale on August 16, 2024 in Los Angeles, California. United States real estate industry rules governing agent commissions will change on August 17 as part of a legal settlement between the National Association of Realtors and home sellers. (Photo by Patrick T. Fallon / AFP) (Photo by PATRICK T. FALLON/AFP via Getty Images)
Patrick T. Fallon | Afp | Getty Images
The supply of homes for sale is still low by historical standards, but it is rising quickly.
Nationwide, active listings in August were up 36% compared with the same month last year, according to a new report from Realtor.com. That was the 10th straight month of annual growth. Supply is still, however, 26% lower than in August 2019, pre-pandemic.
As inventory grows, sellers are pulling back. There were fewer new listings in August (-1%) than there were the year before. The growth in supply is due to the fact that homes are sitting on the market longer.
“This August, as the number of homes on the market continues to climb, price cuts are more common, asking prices are moderating, and homes are taking longer to sell,” wrote Danielle Hale, chief economist at Realtor.com, in a release. “The widely anticipated Fed rate cut has already ushered in lower mortgage rates, but it seems that some buyers and sellers are waiting for additional declines.”
That can be seen in weekly mortgage data. Applications for loans to buy a home are down about 4% compared with this time last year, according to the Mortgage Bankers Association. This, even though the average rate on the 30-year fixed mortgage is about 75 basis points lower now than it was then.
While supply is increasing in most cities, some are seeing huge gains. Tampa, Florida’s inventory is up more than 90% compared with a year ago. San Diego is up 80%, Miami is up 72%, Seattle is up 69% and Denver is up 67%.
Regionally, active listings rose 46% in the South, 35.7% in the West, 23.8% in the Midwest and 15.1% in the Northeast.
More supply is causing homes to sit for sale longer. The typical home spent 53 days on the market in August, an increase of seven days from a year ago and the slowest August pace in five years.
“We have found that the market slows by about one day for every 5.5 percentage point increase in the year-over-year number of active listings,” said Ralph McLaughlin, senior economist at Realtor.com. “Given the rapid growth in inventory we’re seeing now, that can mean changes in some markets of up to 15-20 more days on the market than last year.”
More supply and longer selling times are finally translating into lower prices. The share of homes with price reductions rose in August to 19%, up 3 percentage points from the prior August. The median list price was down 1.3% year over year. Part of that is due to the mix of homes on the market, as more smaller homes are being listed. Prices are still 36% higher than August 2019.