
Ethereum remains under pressure at press time, looking at the formation in the daily chart. In summary, ETH is stable on the last day but down 9% in the last week of trading. Of note, there has been a drastic drop in trading volume over the past few days.
Overall, traders are upbeat, expecting prices to turn around and rip higher, clearing immediate local resistances. Even as this develops, on-chain data points to other developments that leverage traders should closely monitor.
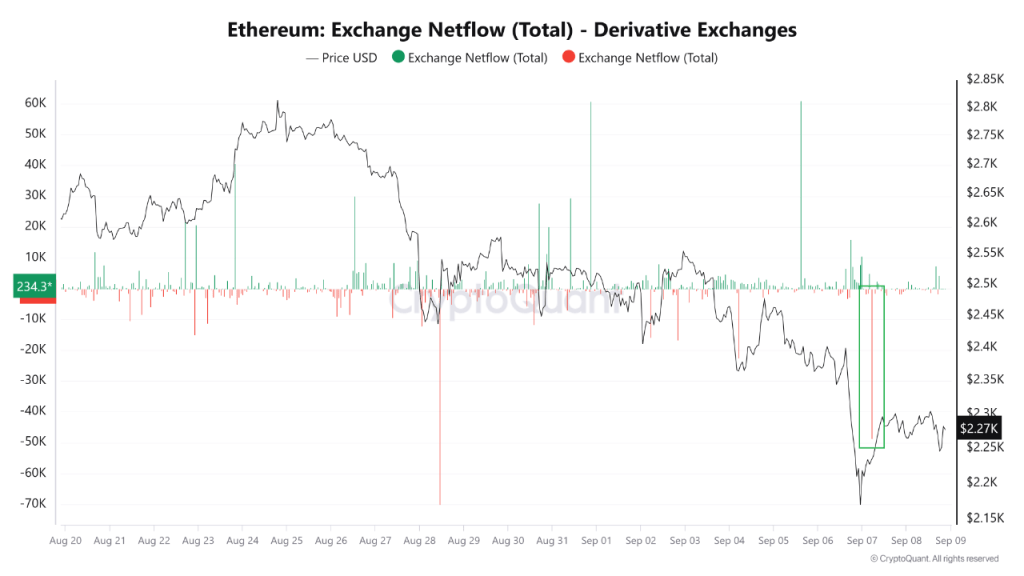
Over 40,000 ETH Moved From Derivatives Exchanges
According to one analyst, citing CryptoQuant data, there have been more outflows from derivative exchanges over the past few trading weeks. Specifically, the analyst observes that over 40,000 ETH have been moved from derivatives trading platforms like Binance and OKX.
From a trading standpoint, whenever there is a spike in outflows from derivatives to spot exchanges, it could suggest that traders are cautious and waiting for clearer definitions before committing. However, this is also positive, especially considering that outflows from derivatives mean increasing inflows to spot exchanges.
When there is a spike in deposits to spot exchanges, especially from derivatives exchanges, not external non-custodial wallets, decreasing speculative pressure can support prices. As outflows increase from derivatives exchanges, it signals that fewer traders are willing to punt on crypto prices, placing leveraged short or long positions.
Reading from this development, how prices evolve in the next few trading sessions will be critical. Technically, a drop below $2,100 and August lows may spark a sell-off, forcing even more leveraged traders to shift to preservation mode and move coins to spot and, from there, possibly to stablecoins.
Conversely, a reversal above $2,800 could lift spirits and sentiment, forming a base for another leg up to $3,000 and $3,500. In turn, confidence will rise, forcing more traders to borrow ETH from exchanges as they place leveraged positions.
Ethereum Gas Fees And Institutional Demand Fading
Amid this development, Ethereum continues to face headwinds. For example, some analysts argue declining gas fees could negatively impact demand, questioning the network’s long-term sustainability.
As of September 9, Ethereum gas fees stood at 2.862 gwei, down from 14.21 gwei registered one year ago, according to YCharts.

Additionally, institutional demand for Ethereum via spot ETFs continues to decline. So far, net outflows from all spot Ethereum ETFs in the United States exceed $568 million, according to SosoValue.
Feature image from Canva, chart from TradingView