Fundamental
Overview
The NFP report on Friday gave the USD a boost as
the data under the hood was better than feared. The probabilities for a 50 bps
cut decreased as a result and they are now standing around 27%.
A soft US CPI report
tomorrow might increase those probabilities a little bit, but we will still
head into the FOMC decision with a 25 bps cut as the most probable scenario.
Nevertheless, the trend in
the labour market remains skewed to the downside and time will tell if the
Fed’s cuts will be enough to stop this trend.
For the Fed, the market
sees a 73% probability of a 25 bps cut at the upcoming meeting and a total of
110 bps of easing by year-end. For the RBA, there’s a 93% chance of no change
at the upcoming meeting with a total of 20 bps of easing expected by year-end.
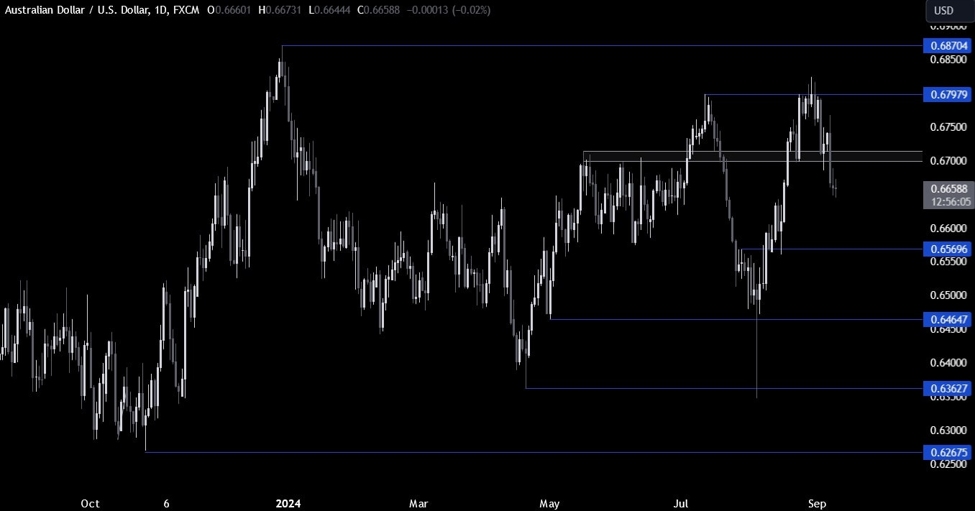
AUDUSD
Technical Analysis – Daily Timeframe
AUDUSD Daily
On the daily chart, we can
see that AUDUSD broke below the key 0.67 support
and extended the drop into the 0.6650 level. The price is now right in the
middle of two key levels. The sellers will want to see a pullback into the 0.67
resistance to position for a drop into the 0.6570 level next with a better risk
to reward setup. The buyers, on the other hand, will want to see the price
breaking higher to position for a rally into the 0.68 handle.
AUDUSD Technical
Analysis – 4 hour Timeframe
AUDUSD 4 hour
On the 4 hour chart, we can
see that the bearish momentum has lost some momentum near the swing level
around the 0.6643 level. This is where we can expect the buyers to step in with
a defined risk below the level to position for a rally into the 0.67 resistance.
The sellers, on the other hand, will want to see the price breaking lower to
increase the bearish bets into the 0.6570 level.
AUDUSD Technical
Analysis – 1 hour Timeframe
AUDUSD 1 hour
On the 1 hour chart, we can
see that we have a minor resistance around the 0.6673 level which created a
tight range with the 0.6643 support. The buyers will want to see the price
breaking higher to increase the bullish bets into the 0.67 resistance, while
the sellers will look for a break lower to position for a drop into the 0.6570
level. The red lines define the average daily range for today.
Upcoming
Catalysts
Today we have the US Small Business Optimism Index. Tomorrow, we get the US
CPI report. On Thursday, we have the latest US Jobless Claims figures and the
US PPI data. On Friday, we conclude the week with the University of Michigan
Consumer Sentiment report.