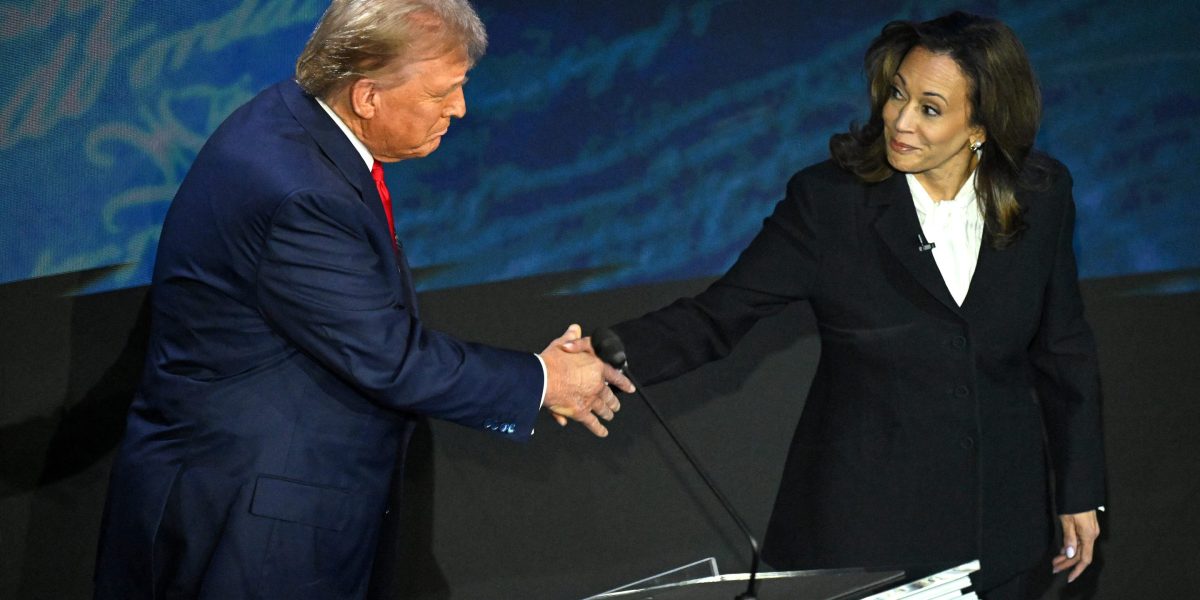

In the wake of the latest presidential debate between Vice President Kamala Harris and former President Donald Trump, election polls are in the spotlight.
Harris now has a slight edge in many national polls. The New York Times has Harris ahead, with 49% odds compared with Trump’s 47%, while Project FiveThirtyEight and ABC give the vice president a 47% chance of winning compared with Trump’s 44.3%. However, on Polymarket, the world’s largest prediction betting market, Harris and Trump are tied, with each having a 49% chance of being elected the next president of the United States.
While these election polls will get most of the headlines, it turns out Americans might be better off watching the stock market if they want to know who will be in Washington next year.
Election polls’ historical accuracy has been spotty at best. In a 2023 examination of hundreds of U.S. election polls dating back to 1998, FiveThirtyEight senior elections analyst Nathaniel Rakich found that pollsters accurately predicted the winner only 78% of the time, and in 2022, they did so in just 72% of the races.
On the other hand, the S&P 500’s performance between August and October has accurately predicted the winner of every presidential election since 1984. In the years when the blue-chip index rises between August and October, the incumbent party has won every time, but when the S&P 500 has fallen over that period, it’s always signaled an impending victory for the challenger.
Comerica Bank’s chief investment officer John Lynch and senior analyst Matthew Anderson offered a simple explanation for the correlation between stock prices and election outcomes in a Tuesday note to clients. “Equity performance reflects broader economic sentiment,” they wrote. “When voters are satisfied with the economy’s direction, they tend to support the status quo, and when they are dissatisfied, they are more inclined to vote for change.”
Lynch and Anderson noted that while a strong stock market performance for the full year before an election has also been heavily correlated with success for the incumbent party, it hasn’t always been a guarantee of success. The S&P 500 rose 14.1% and 13.4% in 1976 and 1980, respectively, but the incumbent party lost the election during both of those inflation-heavy years.
Another election predictor worth watching
With Lynch and Anderson pointing to broader economic sentiment as perhaps the key reason why rising stock prices are highly correlated with incumbent party presidential election victories, there’s another election predictor that may be worth watching: the Misery Index.
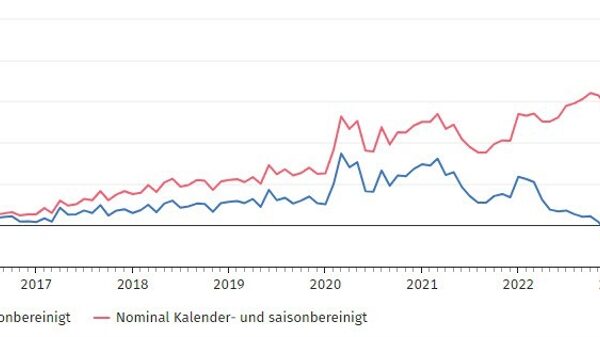
The Misery Index combines the seasonally adjusted unemployment rate and the annual inflation rate into a single measure in an attempt to gauge the economic pain that average Americans are feeling. A higher number signals consumers are struggling with rising prices and finding jobs, leading to more economic “misery.”
The three-month moving average of the Misery Index between August and October has accurately predicted every presidential election since 1980, with the incumbent party winning if the index decreases, and losing if it increases.
The latest Misery index reading came in at 6.73% in August. That’s down from a Biden administration peak of 12.66% in July 2022, but up from June’s 6.57%.
“If the rule holds this election, Democrats have about 15 basis points of wiggle room before October,” Lynch and Anderson wrote. “However, the unexpected rise in the unemployment rate in July poses a potential threat to Vice President Harris’s chances.”