Fundamental
Overview
Yesterday, we got the US CPI report and, although as expected it didn’t
have the same large impact as it used to, the core m/m figure surprised to the
upside.
The data triggered a
repricing in interest rates expectations with the market now seeing just a 13%
probability of a 50 bps cut at the upcoming FOMC meeting and less easing
further out the curve.
That weighed on the market
initially but as soon as the European session came to an end, we saw an
incredible reversal that pushed the price above the US NFP high of last Friday.
Right now, it looks like
the Fed is going to cut rates into a resilient economy, which is generally a
positive driver for the stock market but keep an eye on the growth and labour
market data as the market has become very sensitive to soft figures on that
front.
Nasdaq
Technical Analysis – Daily Timeframe
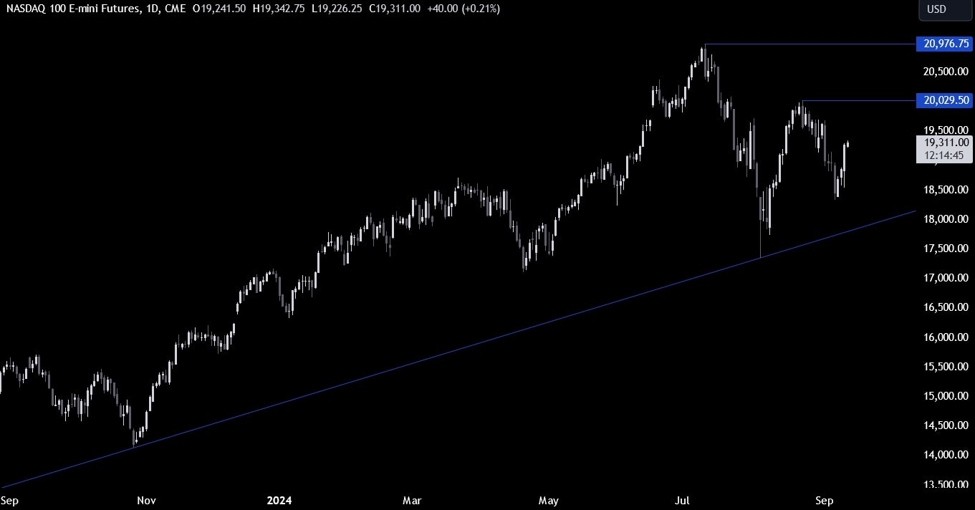
Nasdaq Daily
On the daily chart, we can
see that the Nasdaq yesterday rallied above the post NFP high which could be a
signal of further upside in the next weeks. The price is now trading right in
the middle of key levels, so there’s not much we can glean from this timeframe
and we need to zoom in to see some more details.
Nasdaq Technical
Analysis – 4 hour Timeframe
Nasdaq 4 hour
On the 4 hour chart, we can
see that the price is now testing a key trendline
around the 19300 level. This is where we can expect the sellers to step in with
a defined risk above the trendline to position for a drop into new lows. The
buyers, on the other hand, will want to see the price breaking higher to
increase the bullish bets into the 20000 level next.
Nasdaq Technical
Analysis – 1 hour Timeframe
Nasdaq 1 hour
On the 1 hour chart, we can
see the incredible rally from yesterday’s post-US CPI weakness that paused
right at the trendline. If we get a rejection and the price falls below the
19145 level, then we might see the bearish momentum increasing as the sellers
will start to increase the bearish bets. The red lines define the average daily range for today.
Upcoming Catalysts
Today we get the latest US Jobless Claims figures and the US PPI data. Tomorrow,
we conclude the week with the University of Michigan Consumer Sentiment report.